I would recommend installing collectd, influx and grafana on a second server to let you capture and graph the displays over time…
Note: you only need collectd on this second server – for the types definition
On the DUT
So on the DUT you will need to configure collectd to send the metrics it collects to the server running influx + grafana using the network plugin:
<Plugin "network">
Server "influx server ip" "25826"
</Plugin>
On the Influx/Grafana server:
Configure Influxdb repos and install it:
$ curl -sL https://repos.influxdata.com/influxdb.key | sudo apt-key add -
This will create a file called “/etc/apt/sources.list.d/influxdb.list” if it worked.
As root
$ source /etc/lsb-release
$ echo "deb https://repos.influxdata.com/${DISTRIB_ID,,} ${DISTRIB_CODENAME} stable" | sudo tee /etc/apt/sources.list.d/influxdb.list
Modify the collectd influx configuration
$  sudo vi /etc/influxdb/influxdb.conf

[[collectd]]
  enabled = true
  bind-address = ":25826" # the bind address
  database = "collectd" # Name of the database that will be written to
  retention-policy = ""
  batch-size = 5000 # will flush if this many points get buffered
  batch-pending = 10 # number of batches that may be pending in memory
  batch-timeout = "10s"
  read-buffer = 0 # UDP read buffer size, 0 means to use OS default
  typesdb = "/opt/collectd/share/collectd/types.db"
  security-level = "none" # "none", "sign", or "encrypt"
Start InfluxDB
$ sudo service influxdb start
Configure Grafana repos and install it:
$ echo "deb https://packagecloud.io/grafana/stable/debian/ wheezy main" | sudo tee /etc/apt/sources.list.d/grafana.list
$ curl https://packagecloud.io/gpg.key | sudo apt-key add -
$ sudo apt-get update && sudo apt-get install grafana
$ sudo service grafana-server start
Then use a web browser to connect to grafana (http://<serverip>:3000/), using the hostname or IP of your Ubuntu server and port 3000. Log in with admin/admin
After logging in. click on Data Sources in the left menu, and then on Add New in the top menu to add a new datasource.
Choose the following options and click Add. Note: If you’re using Grafana 3.0, the Type will just be “InfluxDB”
Name: collectd
Type: InfluxDB
Url: http://localhost:8086/
Database: collectd
User: admin
Password: admin
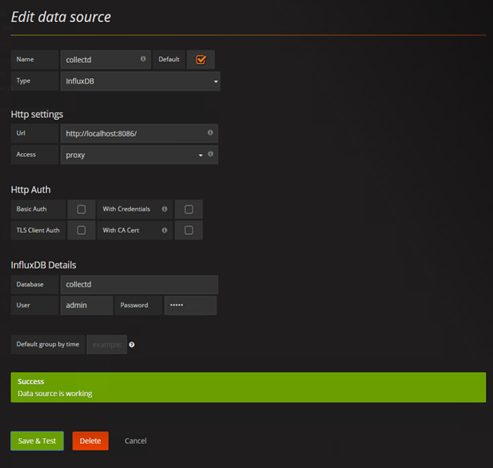
After adding the datasource you will get a Test Connection button at the bottom, which you can use to verify if your settings are correct.
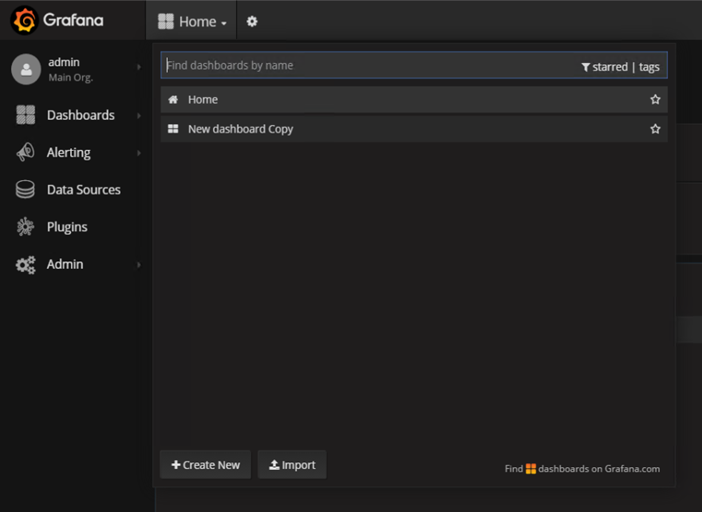
The next step is to create or add a dashboard:
Click on the Dashboards link in the left menu, then the Home menu in the top to get a list of dashboards. Click the Create New button at the bottom to create a new dashboard.
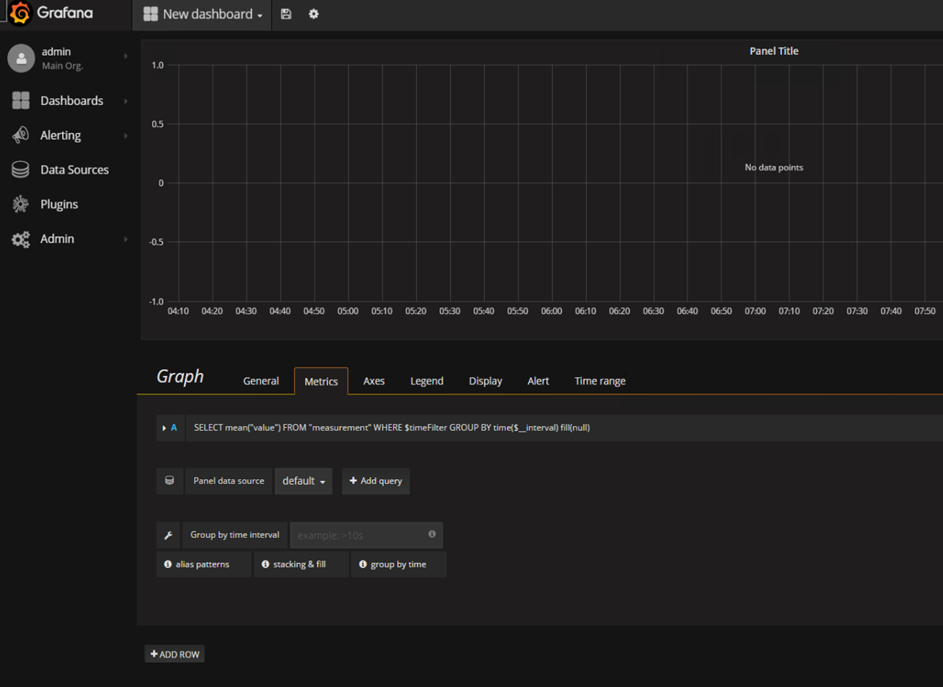
To add a graph, just select the graph button in the panel filter
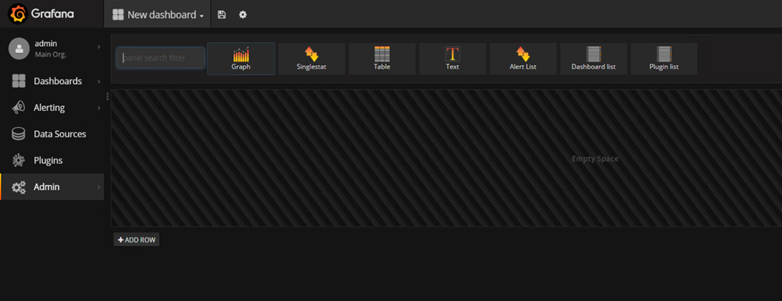
This creates something like the following:
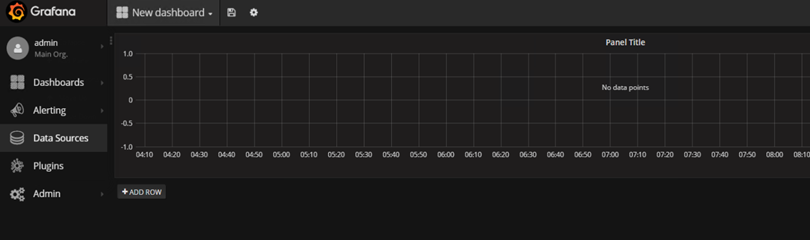
To edit the graph click on the panel title and select the Edit button:
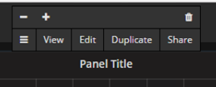
This will open up the graph configuration panel at the bottom of the display
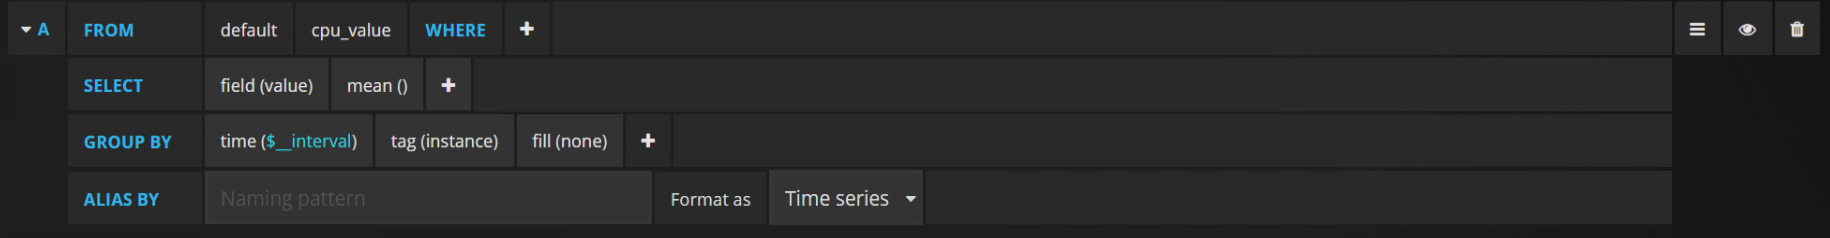
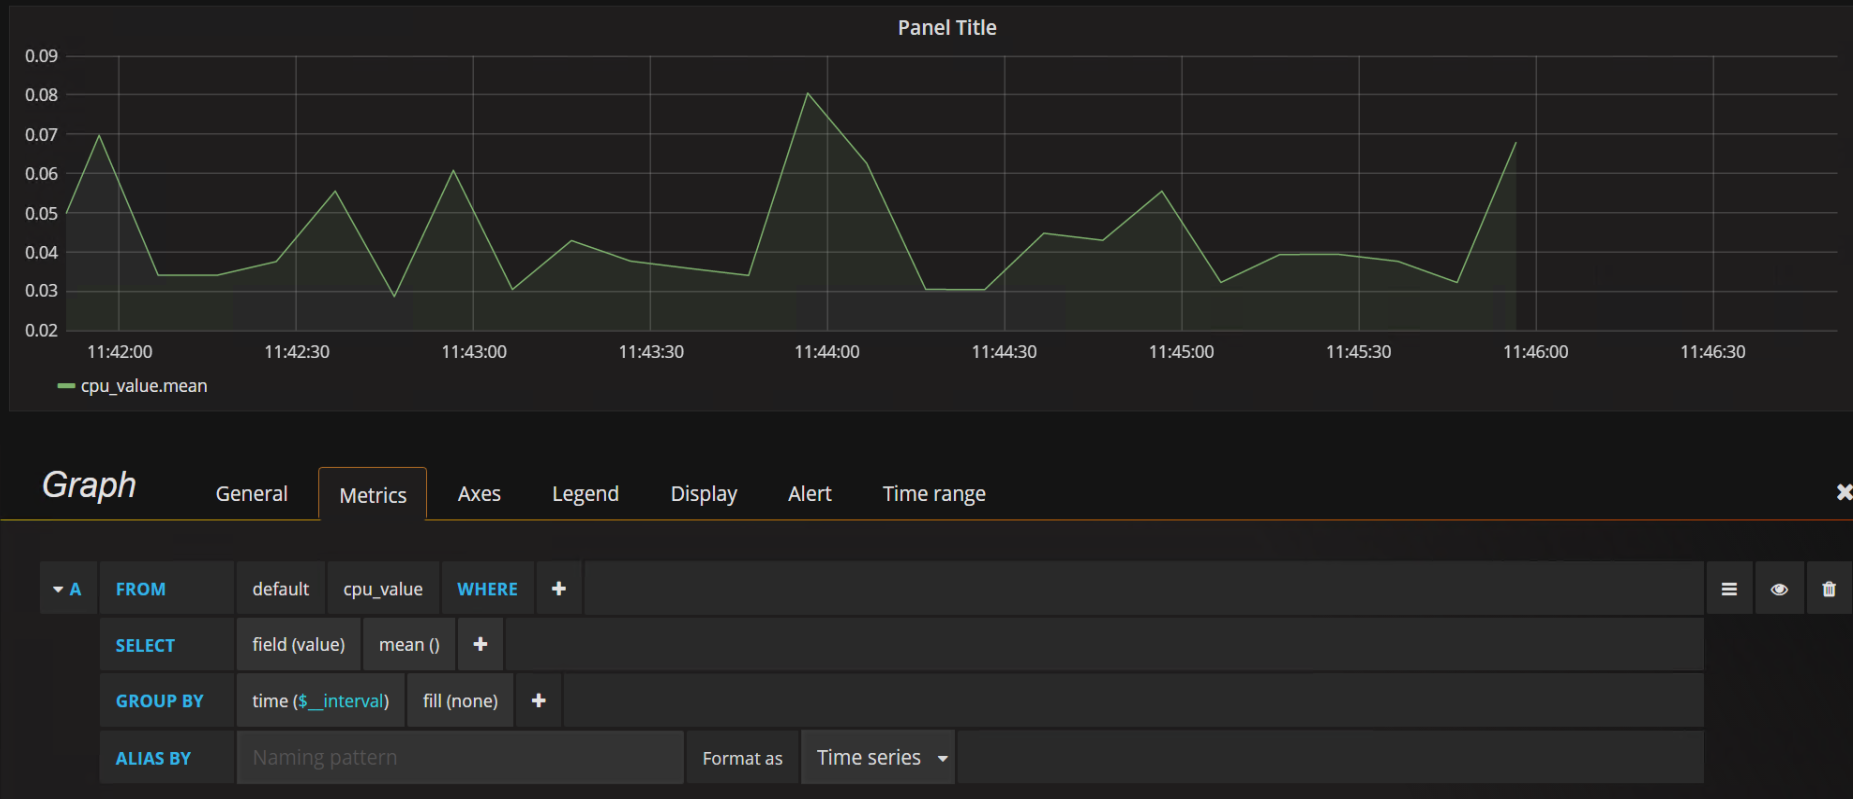
To select a value or multiple values from collectd click the Add query button. An example query is shown below. (Note the tag(instance) in the Group By row is optional and explained below)
In the SELECT row you can specify what fields and functions you want to use. If you have a group by time you need an aggregation function. Some functions like derivative require an aggregation function. More info can be found here: http://docs.grafana.org/features/datasources/influxdb/#field-aggregation-functions
To add more values --> add more queries. OR to add all the values for particular instances use the tag(instance) in the Group By row. For the Query above this results in the graph below:
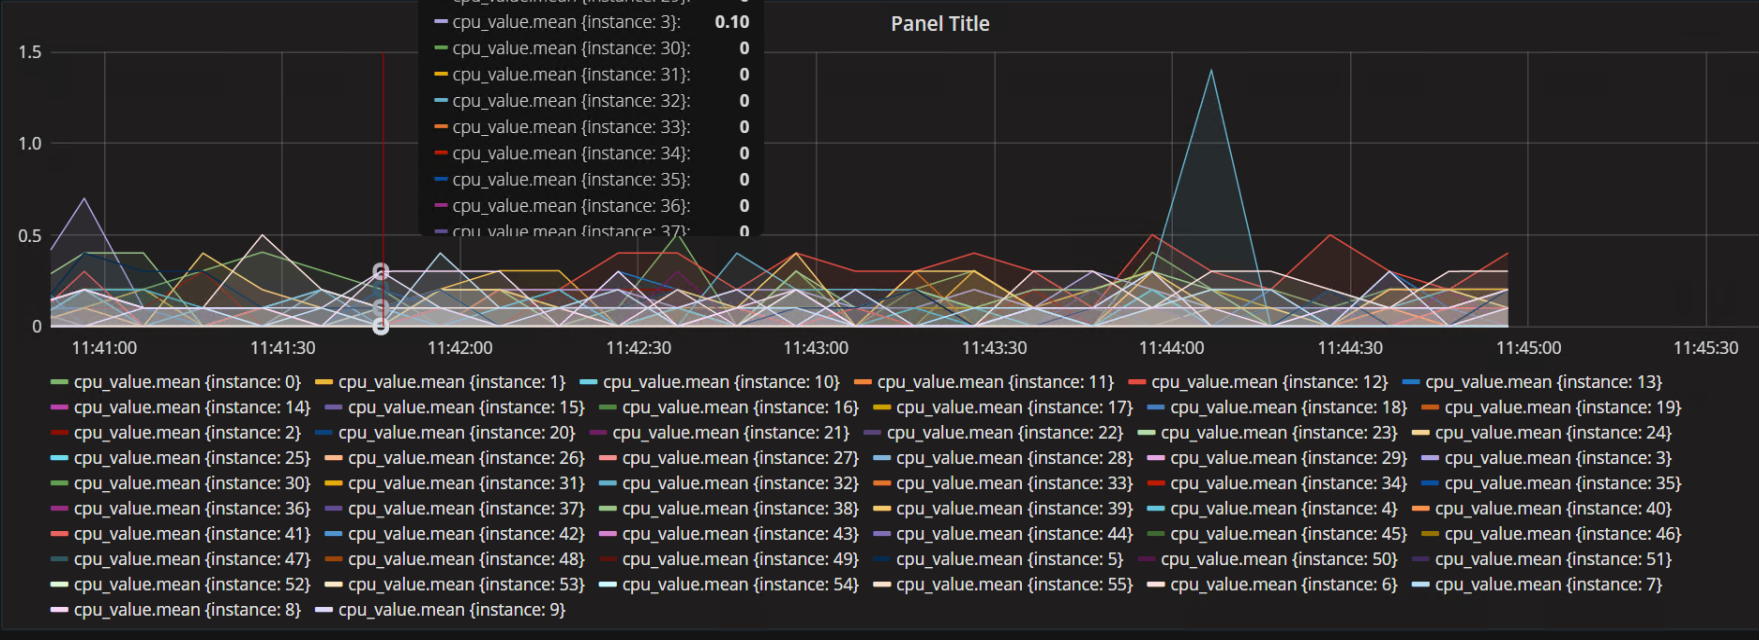
Without it the tag(instance) in the Group By row the graph would only provide one value:
References
http://docs.grafana.org/features/panels/graph/
http://www.andremiller.net/content/grafana-and-influxdb-quickstart-on-ubuntu
https://anomaly.io/collectd-metrics-to-influxdb/
https://github.com/influxdata/influxdb/blob/master/services/collectd/README.md
https://docs.influxdata.com/influxdb/v0.9/introduction/installation/