...
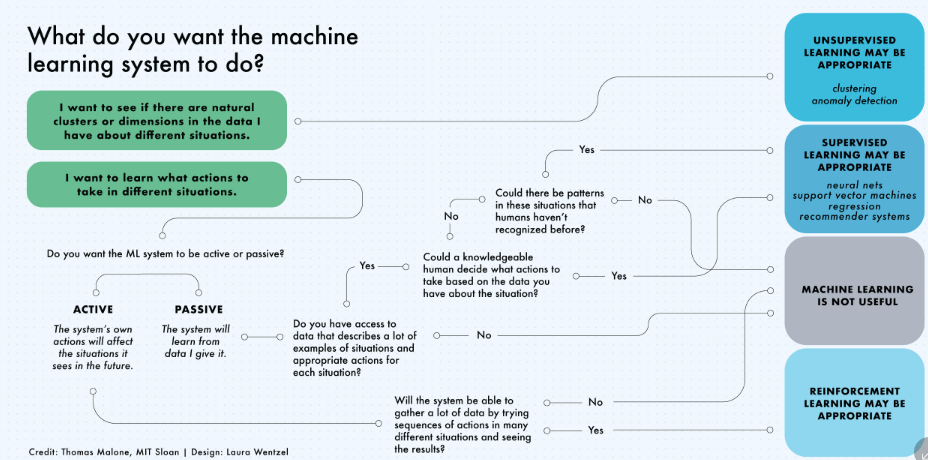
- Supervised learning algorithms make predictions based on a set of examples
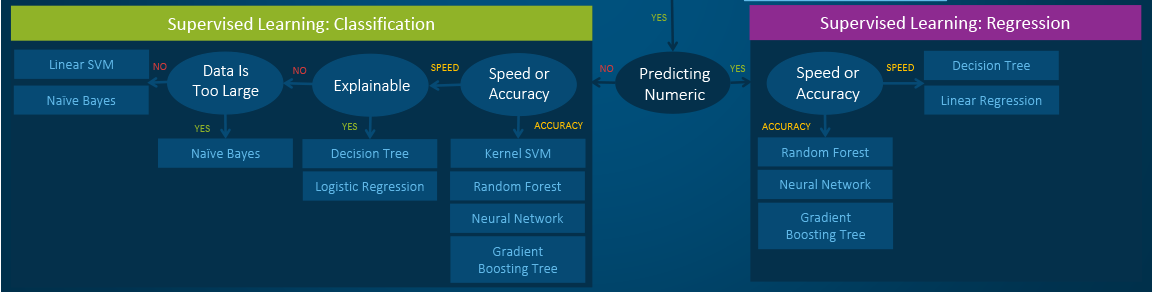
- Classification: When the data are being used to predict a categorical variable, supervised learning is also called classification. This is the case when assigning a label or indicator, either dog or cat to an image. When there are only two labels, this is called binary classification. When there are more than two categories, the problems are called multi-class classification.
- Regression: When predicting continuous values, the problems become a regression problem.
- Forecasting: This is the process of making predictions based on past and present data. It is most commonly used to analyze trends. A common example might be an estimation of the next year sales based on the sales of the current year and previous years.
Algorithms
In progress**
| Name | Comments on Applicability | Reference |
|---|---|---|
| LOGISTIC REGRESSION |
| |
KNN |
| |
| SUPPORT VECTOR MACHINE |
| |
| Kernel SVM |
| |
| RBF Kernel |
So, the rule thumb is: use linear SVMs for linear problems, and nonlinear kernels such as the RBF kernel for non-linear problems. | |
| NAIVE BAYES |
| |
| DECISION TREE CLASSIFICATION |
| |
| RANDOM FOREST CLASSIFICATION |
| |
| GRADIENT BOOSTING CLASSIFICATION |
|
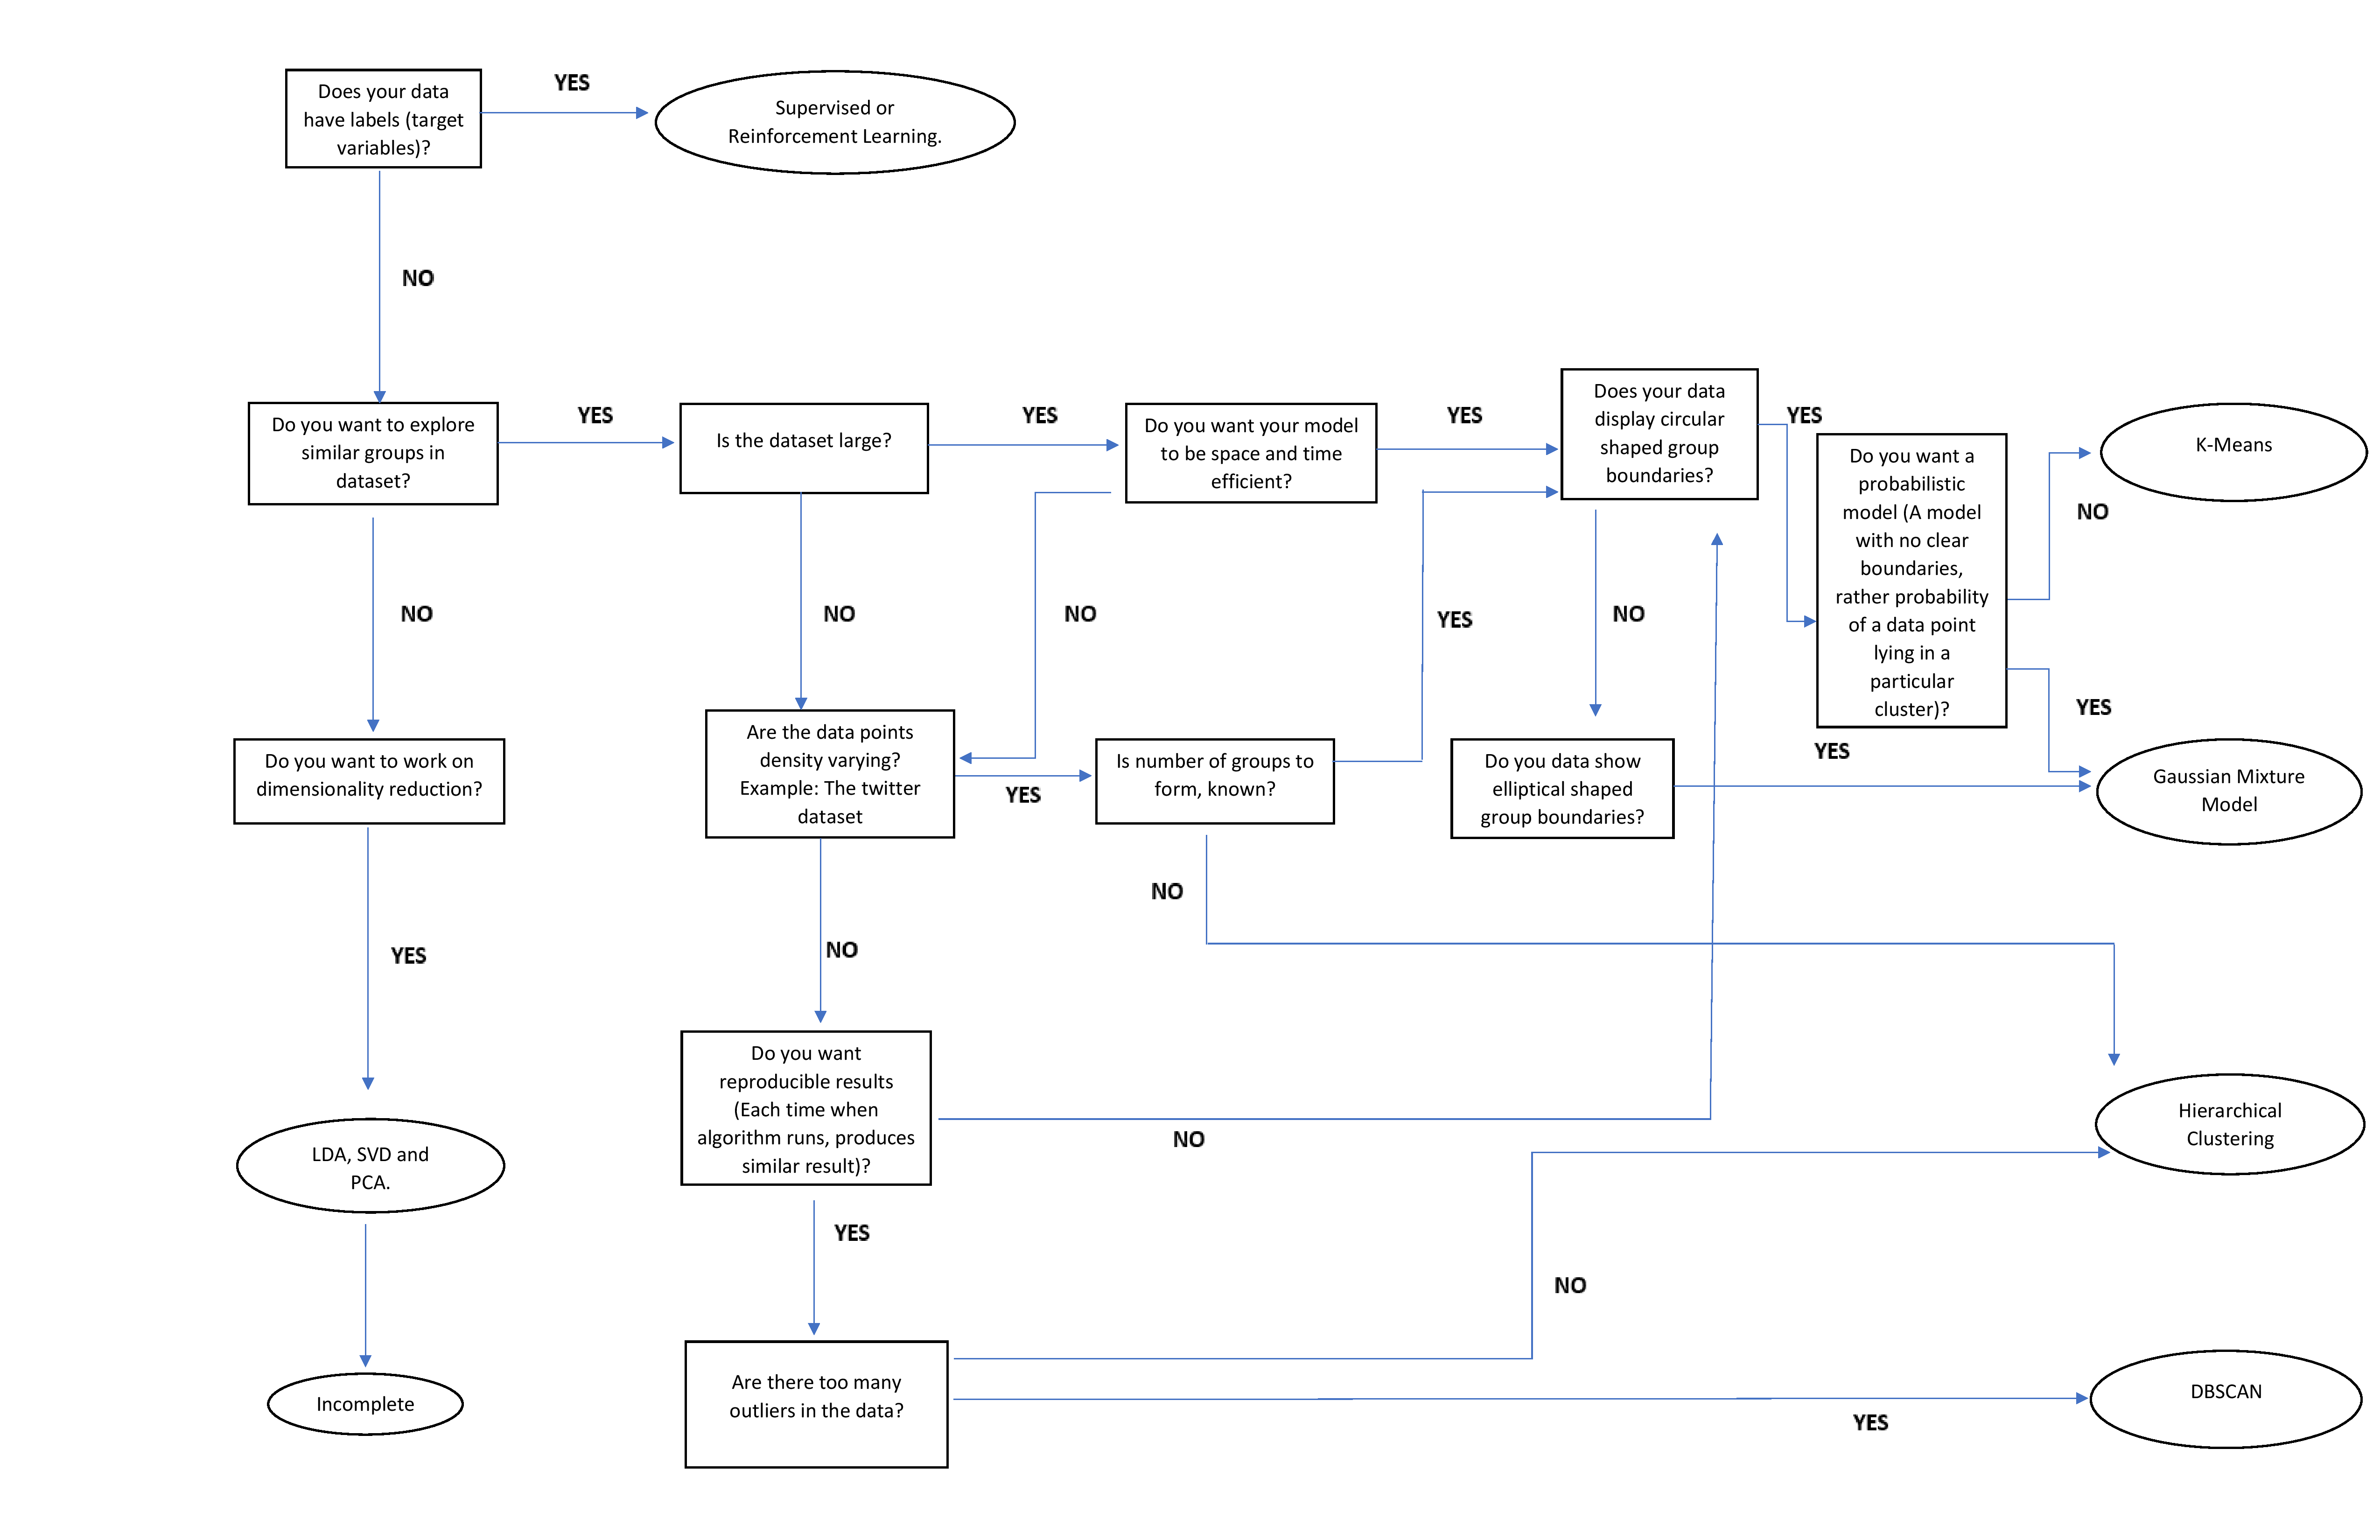
Un-supervised
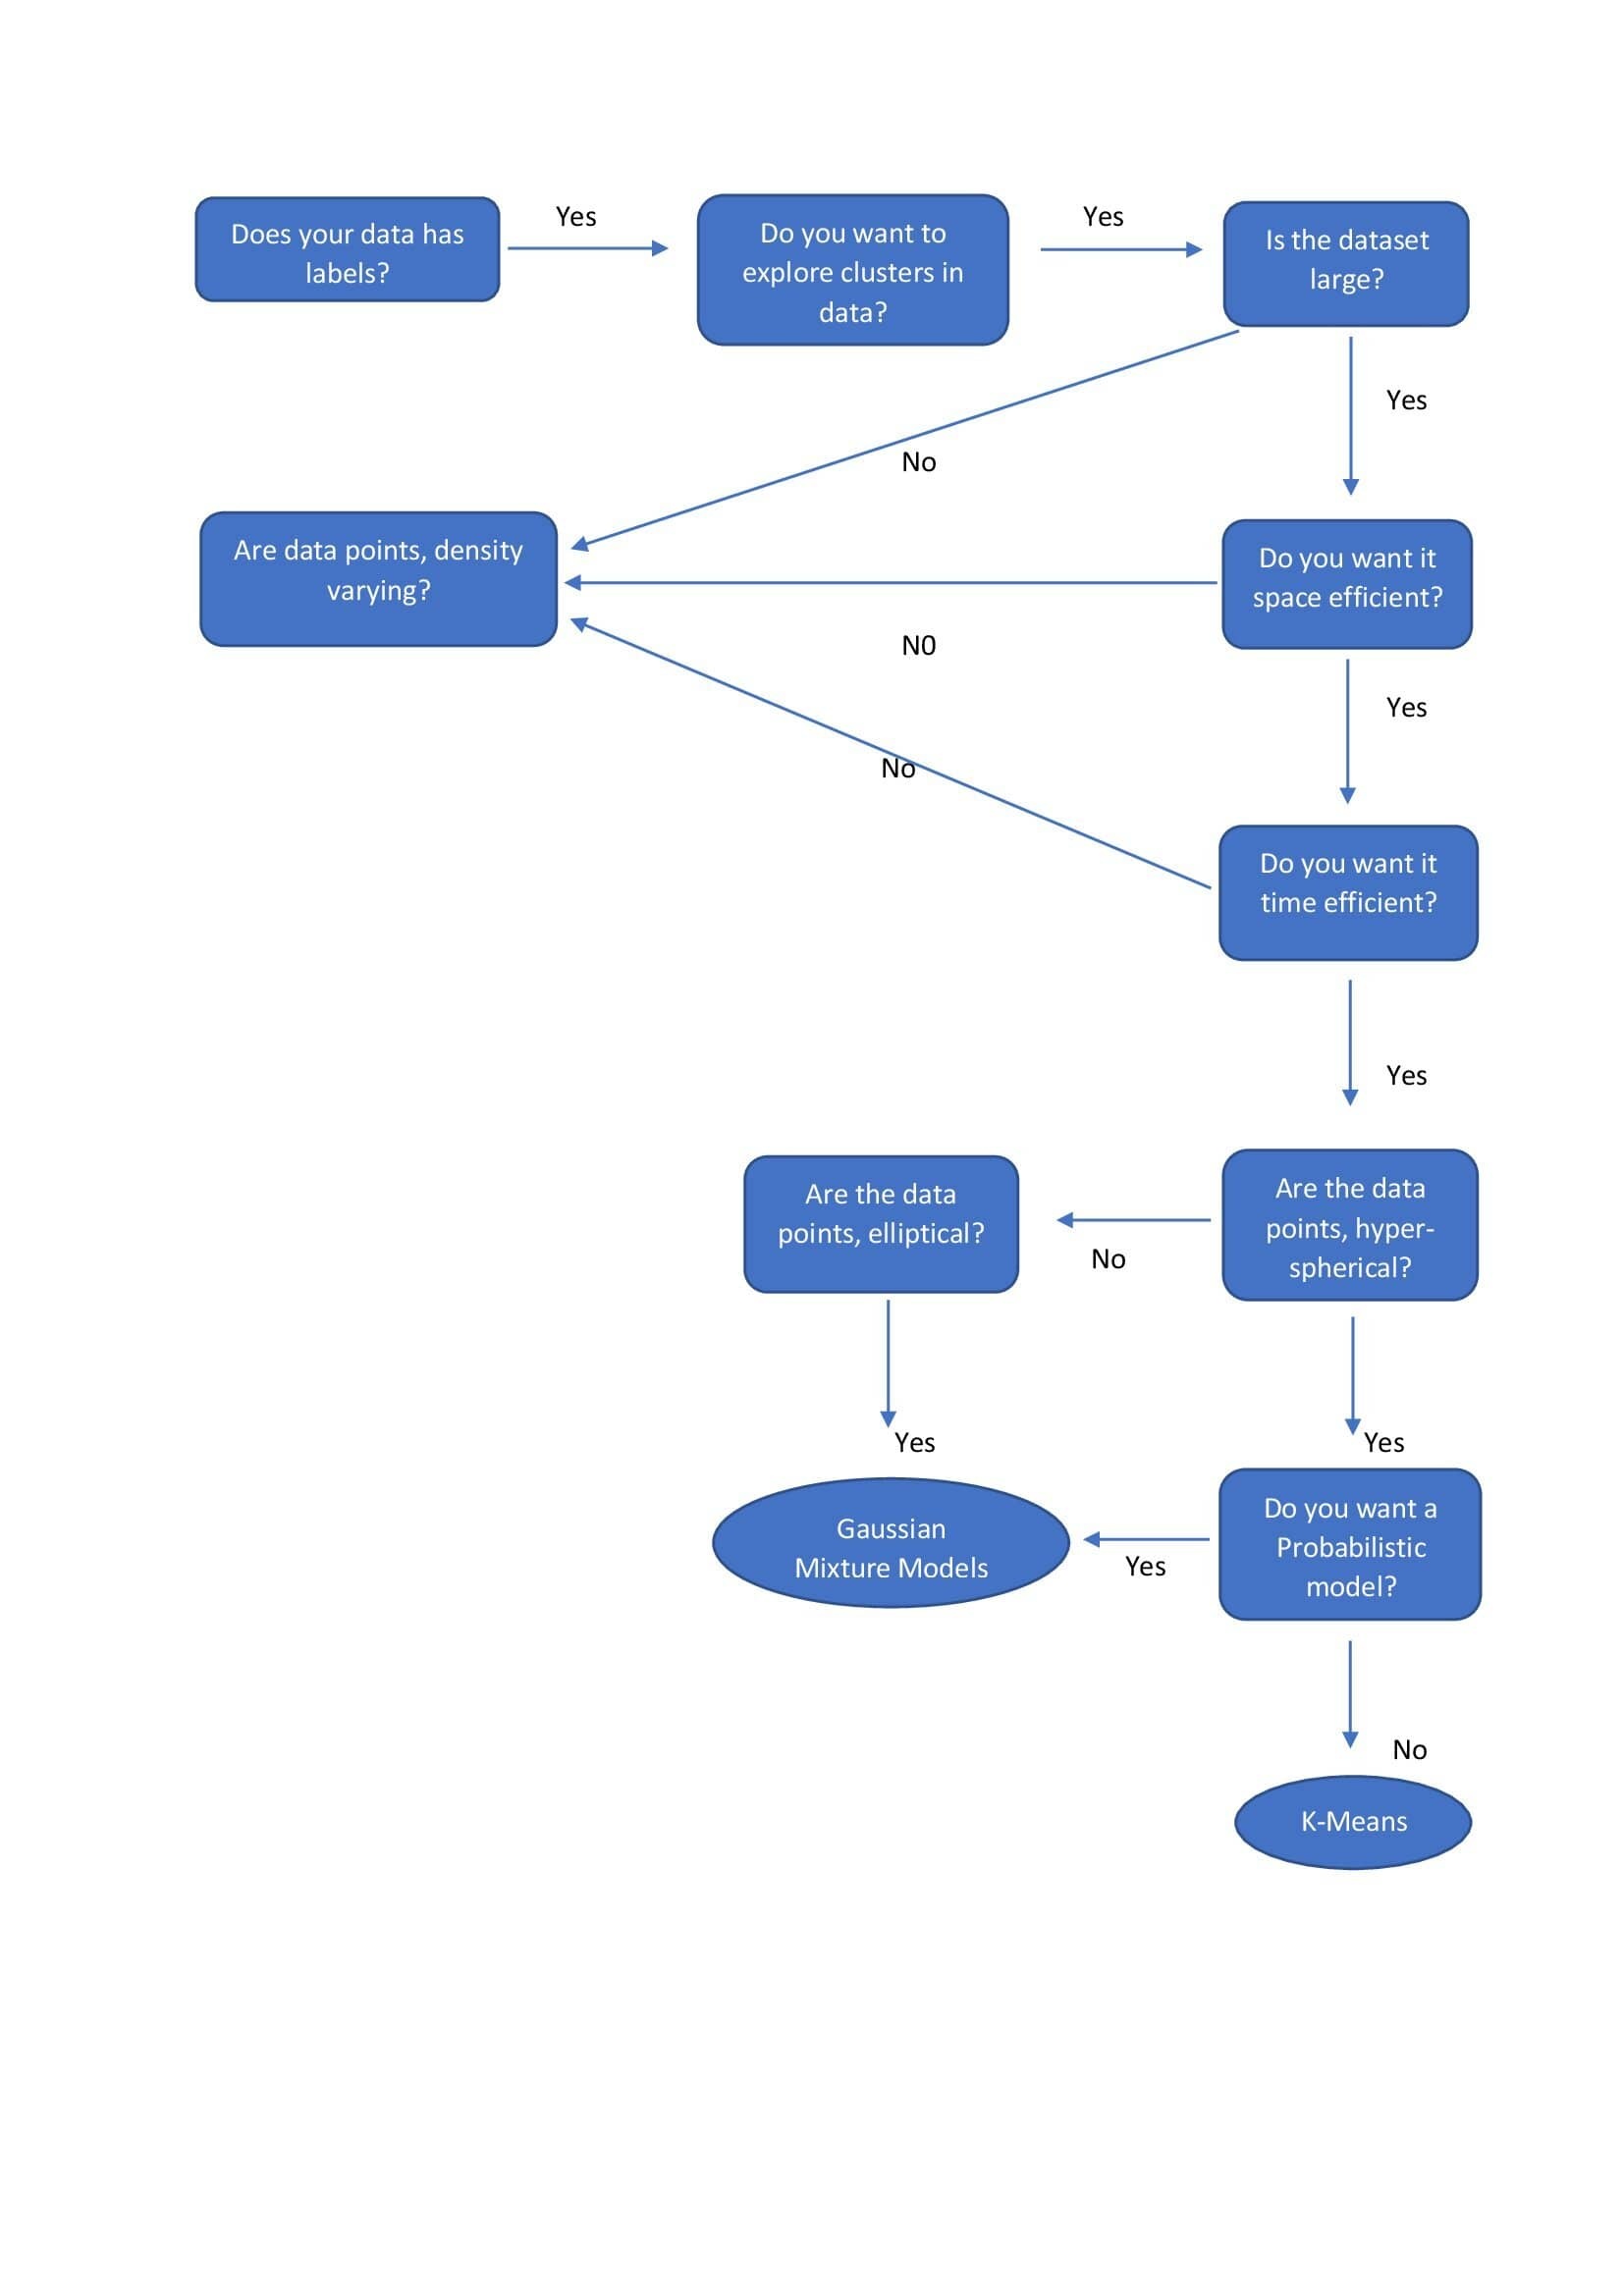
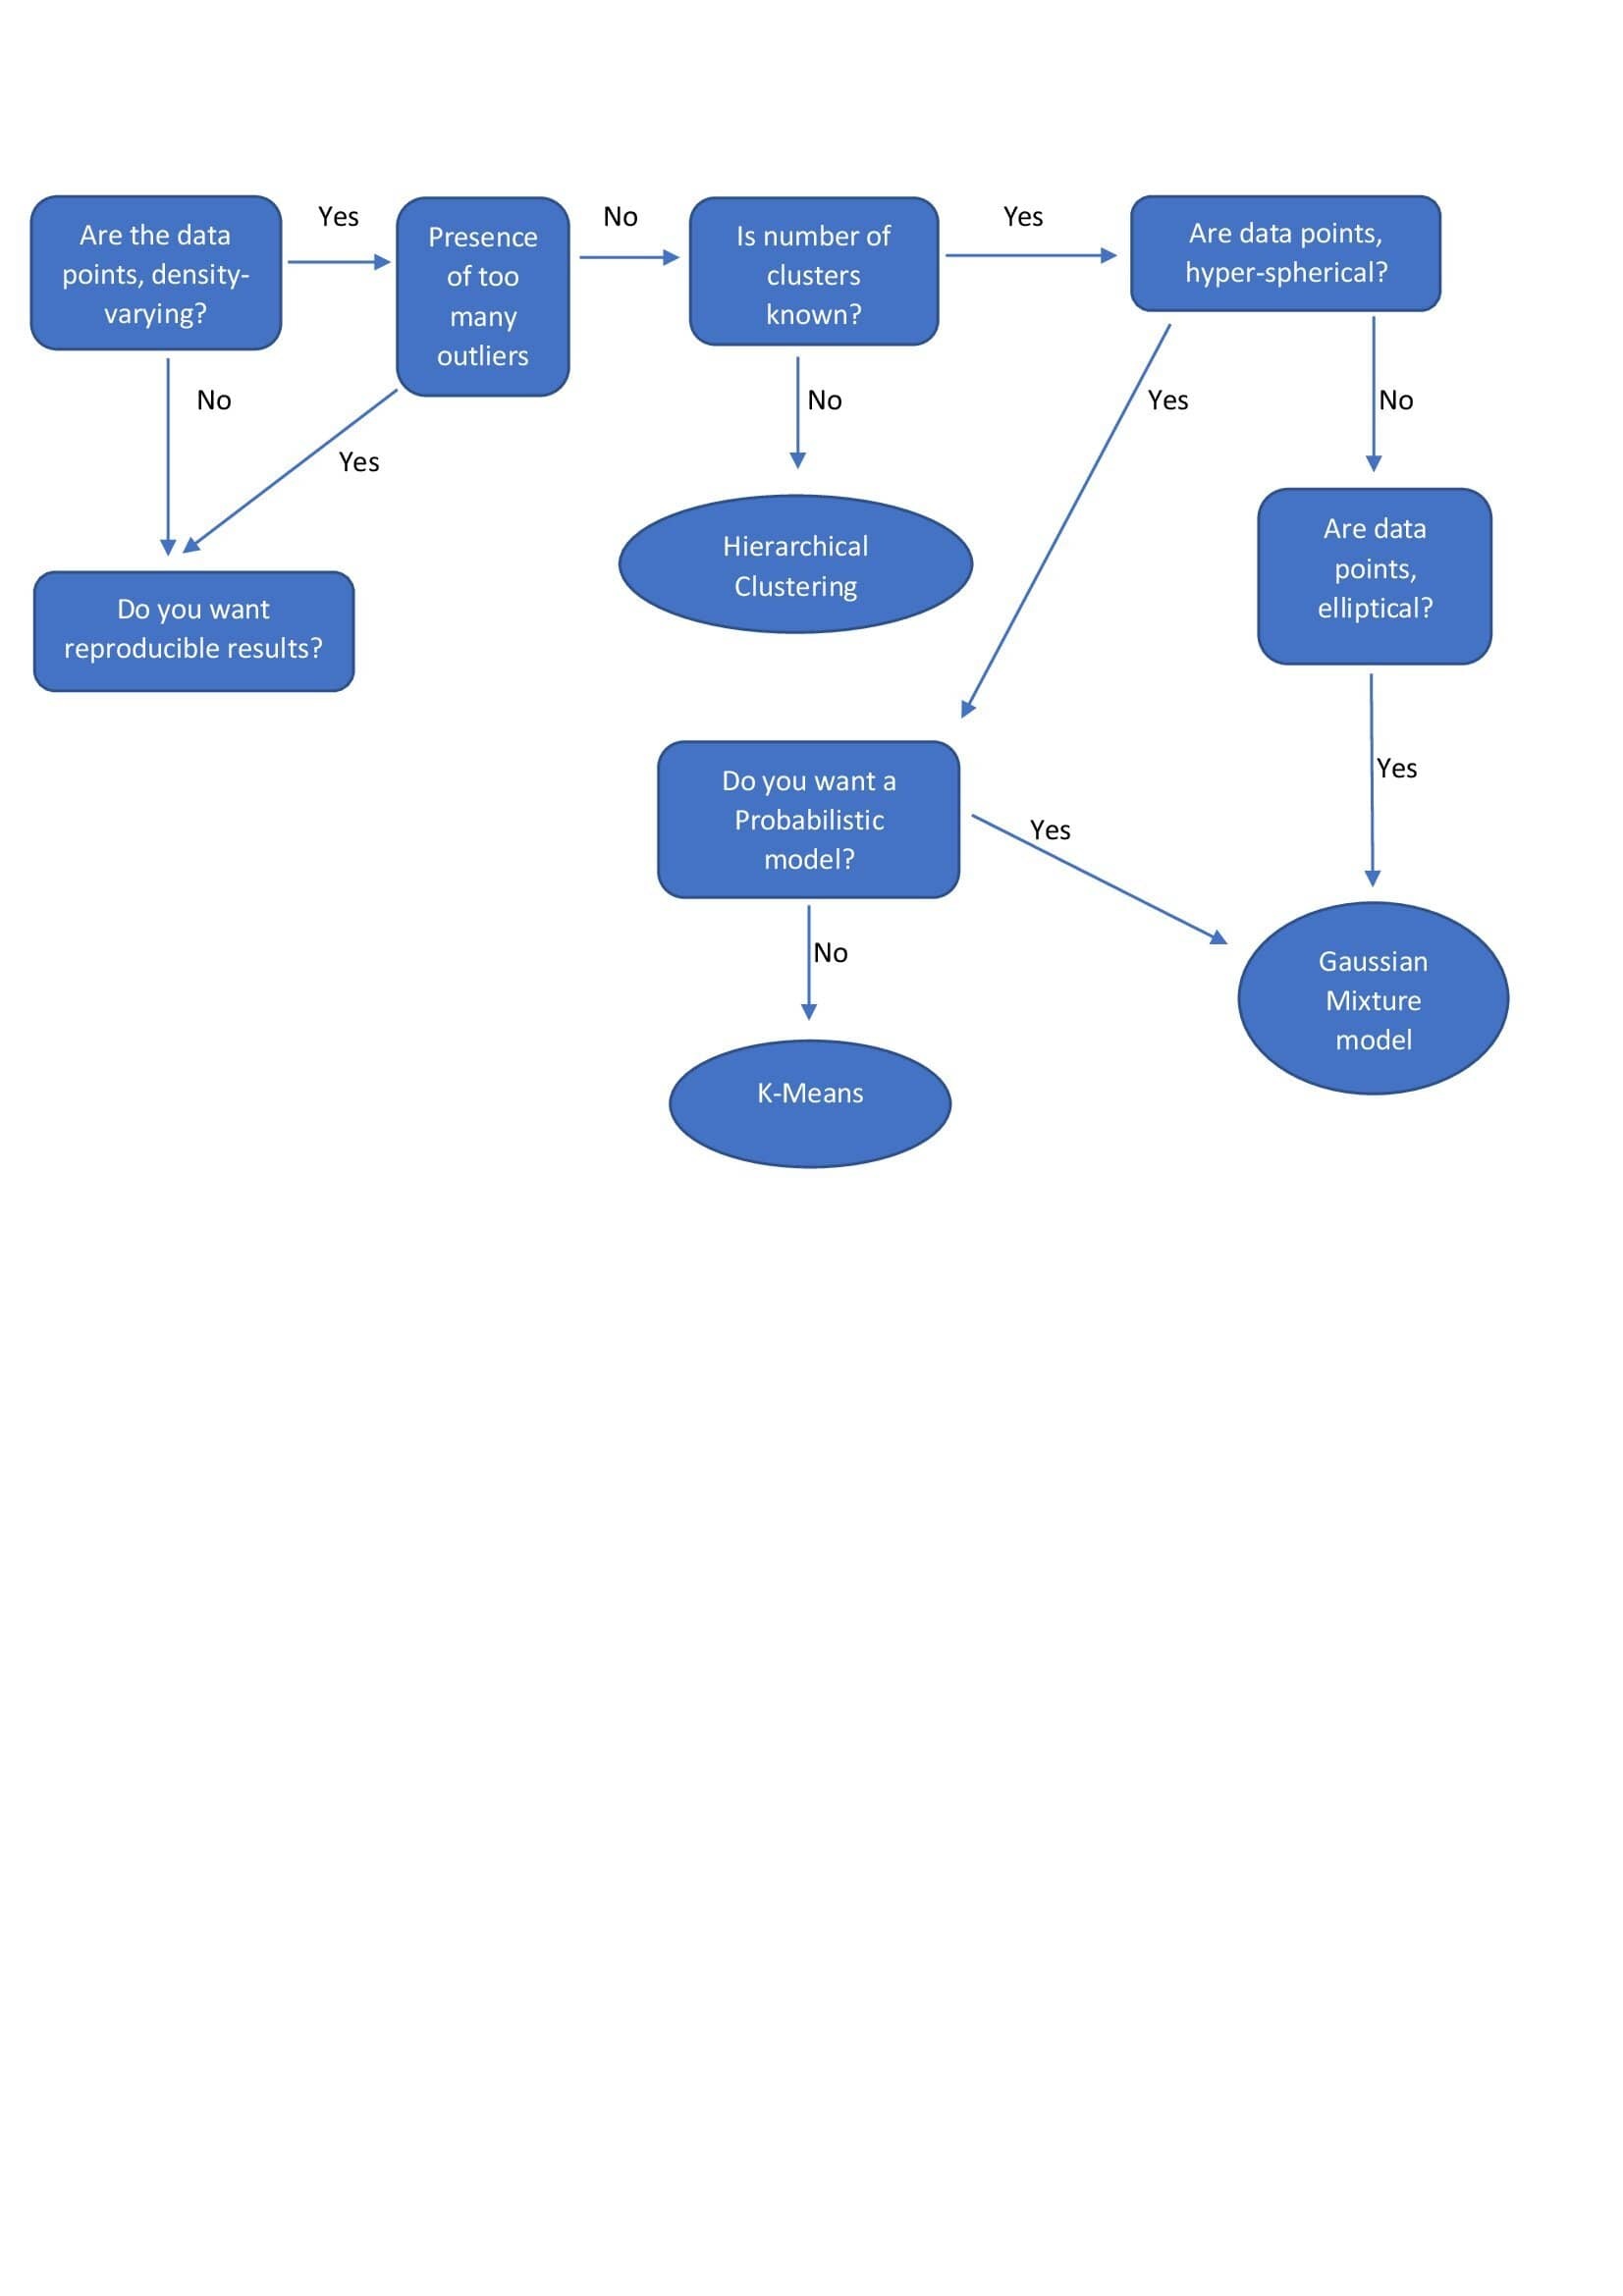
- Clustering - hierarchical clustering, k-means, mixture models, DBSCAN, and OPTICS algorithm
- Anomaly Detection - Local Outlier Factor, and Isolation Forest
- Dimensionality Reduction - Principal component analysis, Independent component analysis, Non-negative matrix factorization, Singular value decomposition
...
| Name | Comments on Applicability | Reference |
|---|---|---|
| Hierarchical Clustering |
| |
| k-means |
| |
| Gaussian Mixture Models |
| |
| DBSCAN |
|
| DIMENSIONALITY REDUCTION ALGORITHMS | APPLICABILITY |
|---|---|
| Linear Discriminant Analysis | It is used to find a linear combination of features that characterizes or separates two or more classes of objects or events. LDA is a supervised LDA is also used for clustering sometimes. And almost always outperforms logistic regression. |
| Principle Component Analysis | It performs a linear mapping of the data from a higher-dimensional space to a lower-dimensional space in such a manner that the variance of the data in the low-dimensional representation is maximized. PCA is unsupervised |
Reinforcement Learning
- Active Learning
- No labeled data
- No supervisor, only reward
- Actions are sequential
- Feedback is delayed, not instantaneous.
- Can afford to make mistakes?
- Is it possible to use a simulated environment for the task?
- Lots of time
- Think about the variables that can define the state of the environment.
- State Variables and Quantify them
- The agent has access to these variables at every time step
- Concrete Reward Function and Compute Reward after action
- Define Policy Function
...