| Table of Contents |
|---|
The easiest way to install InfluxDB & Grafana and configure them to work with Collectd is through using pre-built InfluxDB & Grafana containers. Manual installation steps are detailed further below.
Overview of Pre-built InfluxDB & Grafana Containers
The barometer-influxdb image is based on the influxdb:1.3.7 image from the influxdb dockerhub. To view detils on the base image please visit https://hub.docker.com/_/influxdb/ Page includes details of exposed ports and configurable enviromental variables of the base image.
The barometer-grafana image is based on grafana:4.6.3 image from the grafana dockerhub. To view details on the base image please visit https://hub.docker.com/r/grafana/grafana/ Page includes details on exposed ports and configurable enviromental variables of the base image.
The barometer-grafana image includes pre-configured source and dashboards to display statistics exposed by the barometer-collectd image. The default datasource is an influxdb database running on localhost but the address of the influxdb server can be modified when launching the image by setting the environmental variables influxdb_host to IP or hostname of host on which influxdb server is running.
Additional dashboards can be added to barometer-grafana by mapping a volume to /opt/grafana/dashboards. Incase where a folder is mounted to this volume only files included in this folder will be visible inside barometer-grafana. To ensure all default files are also loaded please ensure they are included in volume folder been mounted.
Installation & Configuration of Pre-built InfluxDB & Grafana Containers
To avoid duplication, detailed up to date steps are provided in the Barometer Docker User Guide. The steps mentioned have been verified for Ubuntu 18.04, 16.04 & Centos 7.5.
Steps related to scalable deployment of Collectd, InfluxDB & Grafana across multiple nodes is also documented.
Manual Installation of InfluxDB & Grafana
I would recommend installing collectd, influx and grafana on a second server to let you capture and graph the displays over time…
Note: you you only need collectd on this second server – for the types definition
On the DUT
So on the DUT you will need to configure collectd to send the metrics it collects to the server running influx + grafana using the network plugin:
<Plugin "network">
Server "influx server ip" "25826"
</Plugin>
, so you could copy this from any server that has collectd installed
Note: The following steps are recommended for Ubuntu 16.04
On the Influx/Grafana server:
AS ROOT:
Configure Influxdb repos and install it:
| Code Block |
|---|
$ curl -sL https://repos.influxdata.com/influxdb.key | sudo apt-key add - |
This will create a file called “/etc/apt/sources.list.d/influxdb.list” if it worked.
...
| Code Block |
|---|
$ source /etc/lsb-release
$ echo "deb https://repos.influxdata.com/${DISTRIB_ID,,} ${DISTRIB_CODENAME} stable" | sudo tee /etc/apt/sources.list.d/influxdb.list |
Install Influx
| Code Block |
|---|
$ apt-get update && apt-get install influxdb |
Modify the collectd influx configuration
make sure the "typesdb" option is pointing to the collectd types.
search and modify the [[collectd]] block
| Code Block |
|---|
$ sudo vi /etc/influxdb/influxdb.conf [[collectd]] enabled = true bind-address = ":25826" # the bind address database = "collectd" # Name of the database that will be written to retention-policy = "" batch-size = 5000 # will flush if this many points get buffered batch-pending = 10 # number of batches that may be pending in memory batch-timeout = "10s" read-buffer = 0 # UDP read buffer size, 0 means to use OS default typesdb = "/opt/collectd/share/collectd/types.db" security-level = "none" # "none", "sign", or "encrypt" |
IF collectd is not installed on the system - download the types.db file as influx needs this
| Code Block |
|---|
$ mkdir /opt/collectd && mkdir /opt/collectd/share && mkdir /opt/collectd/share/collectd && cd /opt/collectd/share/collectd && wget https://raw.githubusercontent.com/collectd/collectd/master/src/types.db && cd - |
Start InfluxDB
| Code Block |
|---|
$ sudo service influxdb start |
Create a collectd database
| Code Block |
|---|
$ influx |
At the prompt type
| Code Block |
|---|
> CREATE DATABASE collectd
> exit |
Configure Grafana repos and install it:
...
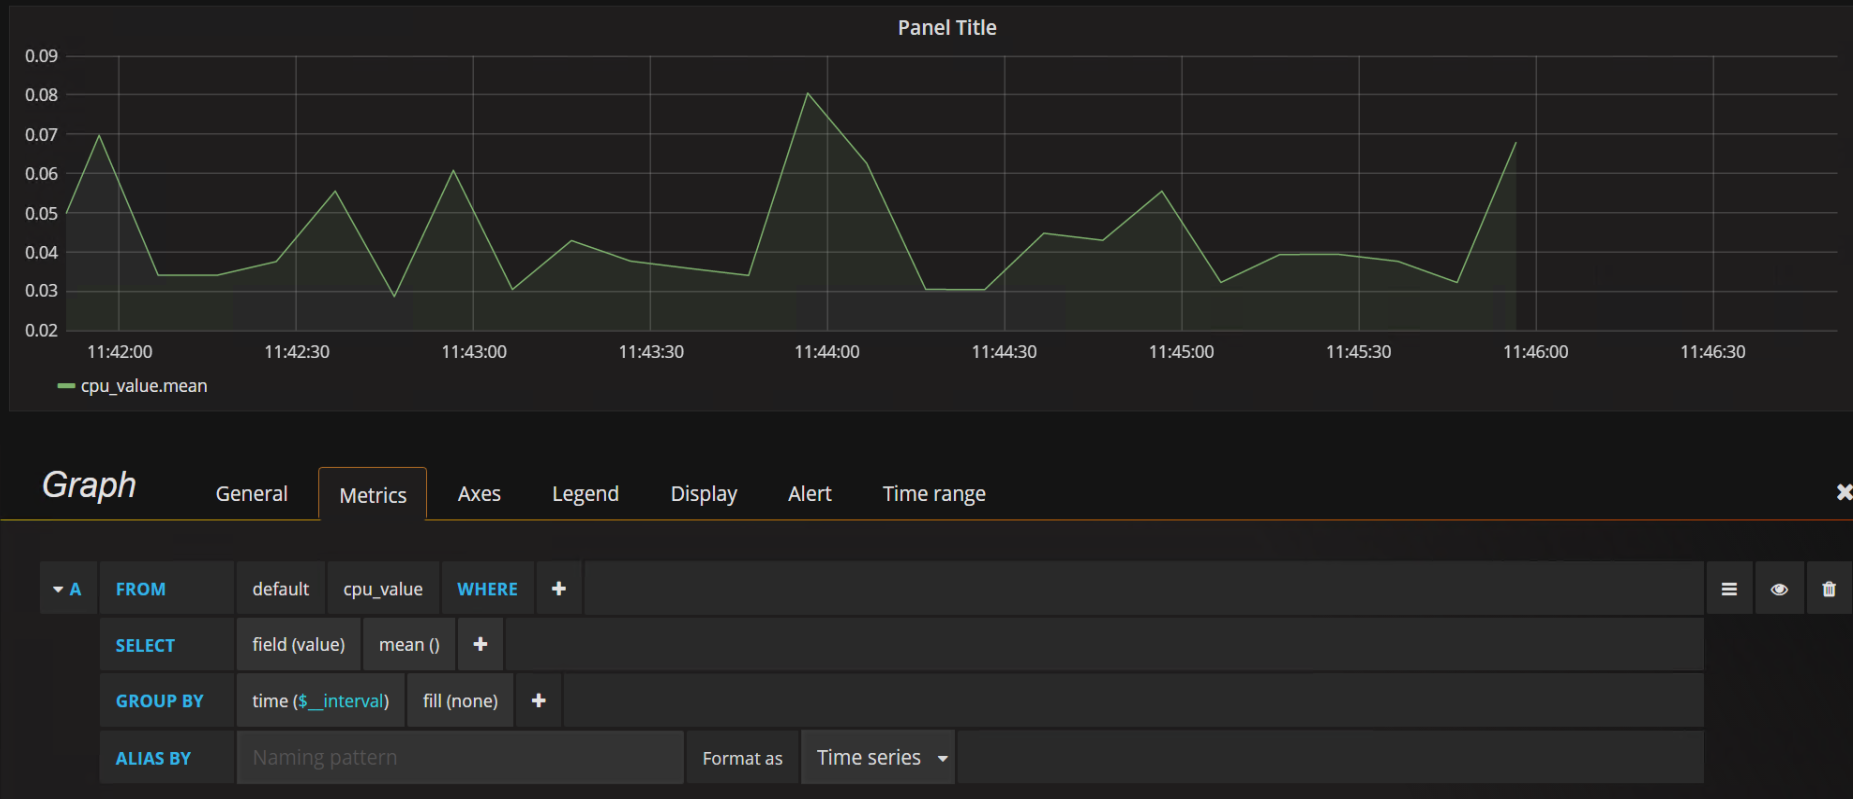
In the SELECT row you can specify what fields and functions you want to use. If you have a group by time you need an aggregation function. Some functions like derivative require an aggregation function. More info can be found here: http://docs.grafana.org/features/datasources/influxdb/#field-aggregation-functions
Recommendation here is to have the fill field in the the Group By row set to none.
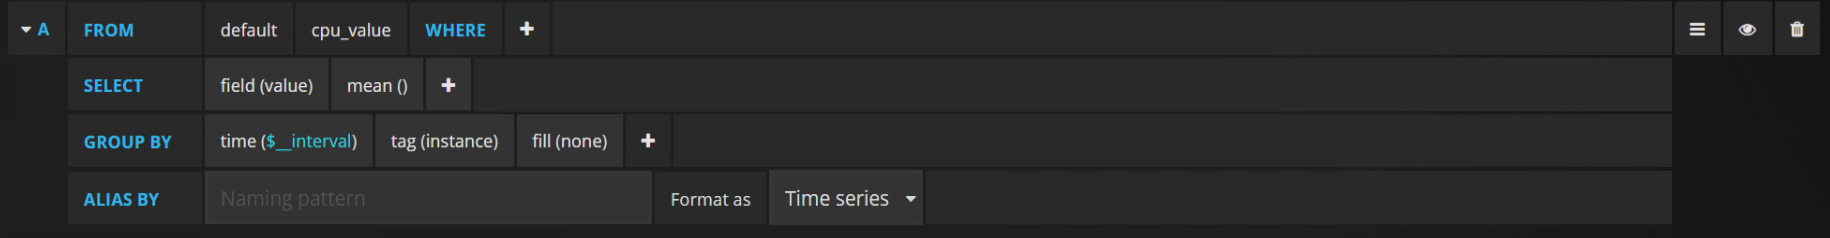
To add more values --> add more queries. OR to add all the values for particular instances use the tag(instance) in the Group By row. For the Query above this results in the graph below:
...
Without it the tag(instance) in the Group By row the graph would only provide one value:
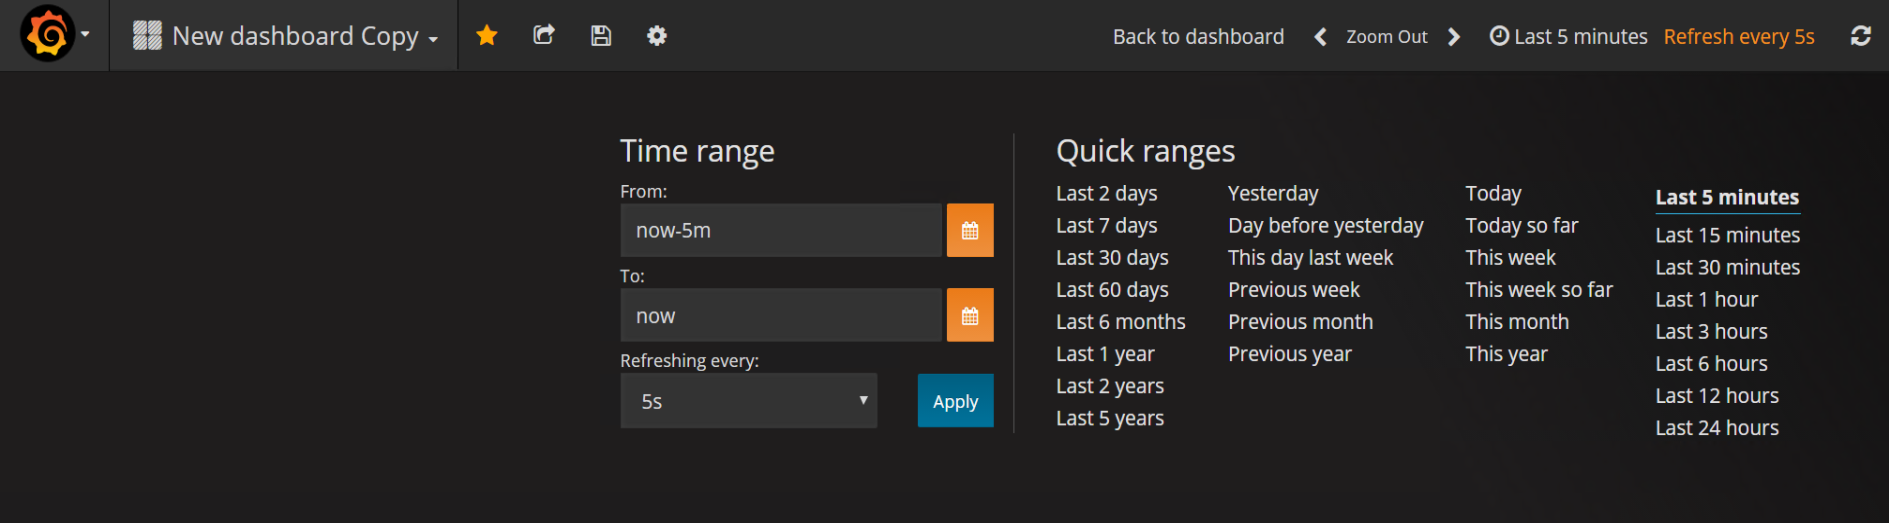
to modify the refresh rate and the graphing scale, click on the <clock-symbol "Last" time period> link on the top right of the menu bar. This will present various timing options. Select the time scale you want to use from the quick ranges or manually configure it and update the refresh rate in the "Refreshing every" option from off to a suitable value. If you don't want the graph to automatically refresh simple leave the "Refreshing every" option set to off
References
http://docs.grafana.org/features/panels/graph/
...