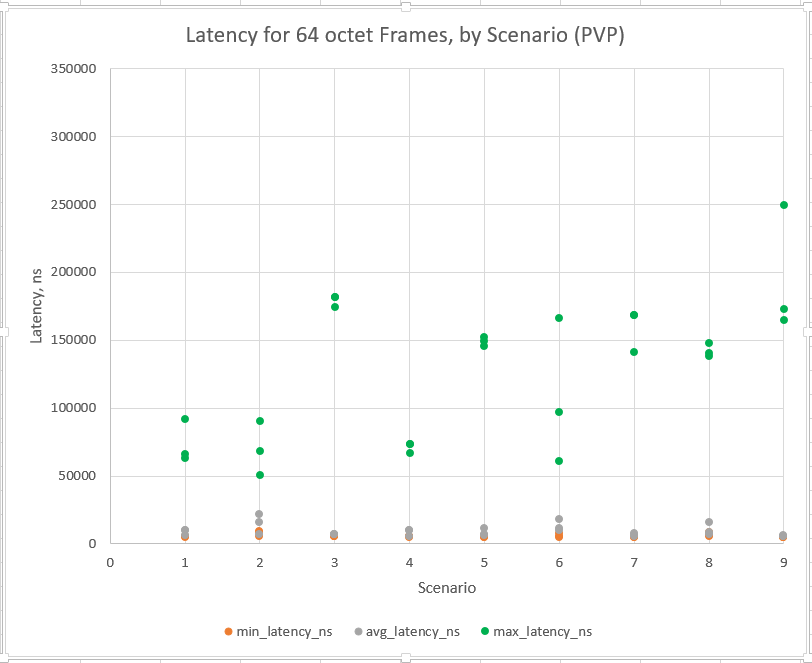
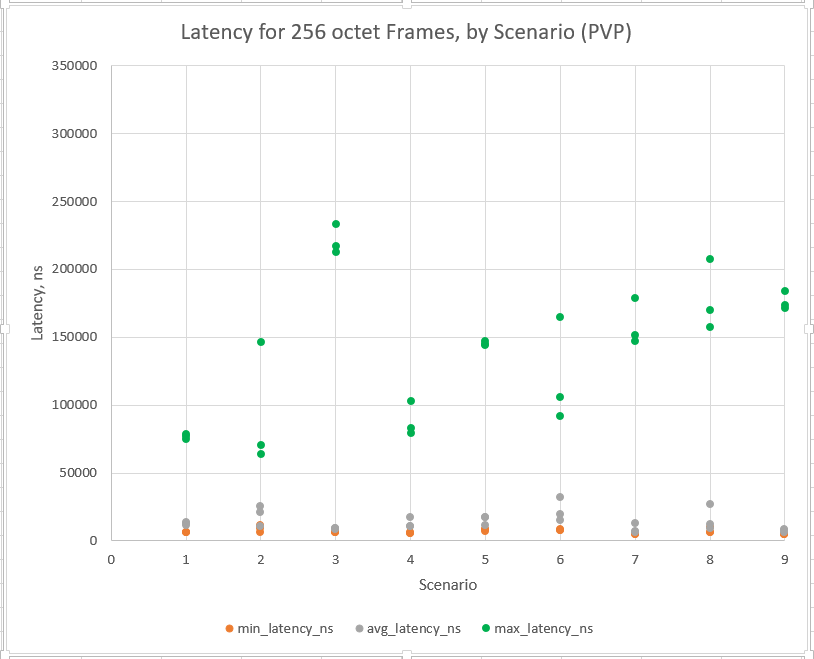
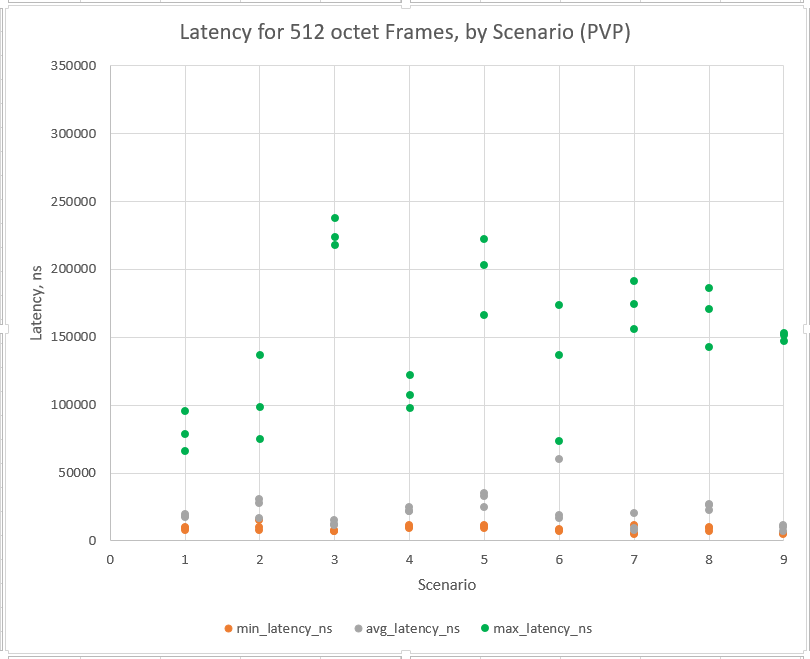
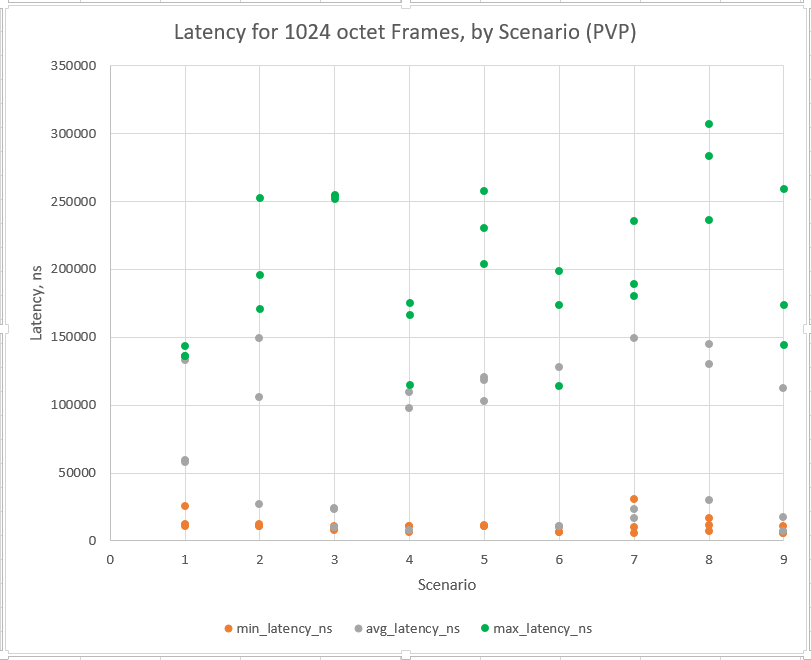
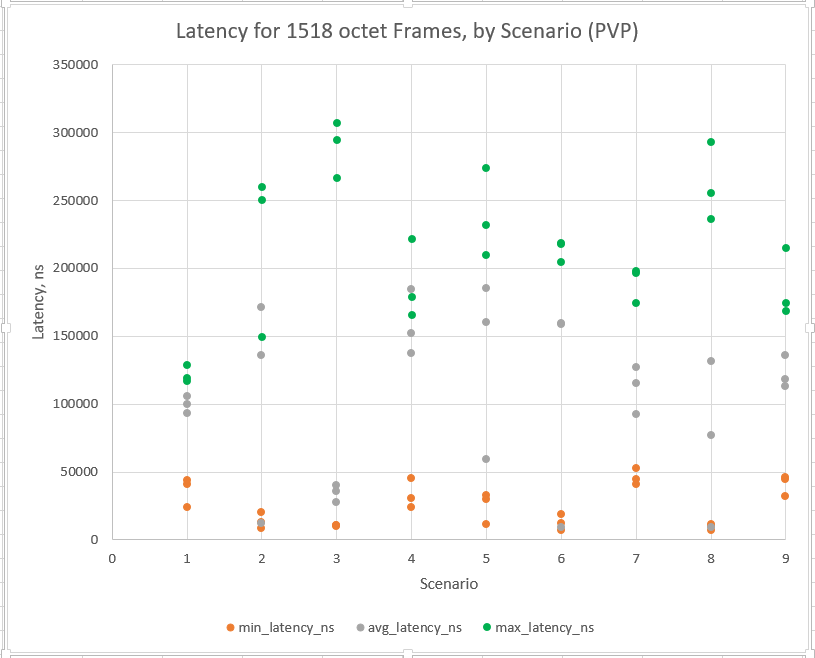
These are plots of min, average, and max latency for the RFC2544 Throughput Load (zero loss).
Each plot includes all 9 Cross-NUMA node Scenarios and all Repeated Tests (Runs) for a single Frame size (only 64, 256, 512, 1024, and 1518 were plotted). Min and Average Latency are fairly stable and <50,00 nsec for Frame sizes of 512 octets or less. However, the average and Max values increase into the 300,000nsec range for 1024 and 1518 octet frames. This may be due to the transition between frame header processing rate limits (at lower frame sizes) and link capacity limitations for the larger Frame sizes.
Although Scenario 3 produces some of the highest Max latency values, the average Latency remains low for all plotted Frame sizes.