...
One of the telecom requirement of fault management for NFV is high scalability monitoring and advanced analytics. Distributed Monitoring and Analytics is the framework for fault management (FM), the architecture of DMA is to integrate each function of FM into each computing node. These functions are collecting, storing, evaluating, analysing, etc. Current centralized monitoring framework is strong and stable, but not high scalability. Distribution approach for FM is one of the solution for NFV. Using DMA, you can get the high scalability monitoring and advanced analytics.
Architecture
TBA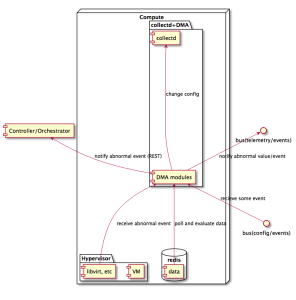
Use cases
- For detecting silent failures
To detect micro burst traffic is little difficult using centralized monitoring, because you have to set monitoring interval very short and this setting is high load. In DMA, we verified that you can detect the micro burst traffic using collectd less load. - For advanced analytics
Using machine learning, you can easily analyse some abnormal behaviours of computing node. That is very helpful infrastructure operator and VNF operator. We verified using scikit-learn to detect some abnormal behaviours.
Both use cases, you can watch the demo at OpenStack Summit Sydney's video (https://www.openstack.org/videos/summits/sydney-2017/dmadistributed-monitoring-and-analysis-monitoring-practice-and-lifecycle-management-for-telecom)
Current status
You can use the local agent function as a DMA function that is changing collectd config static and annotation that is combining libvirt information and OpenStack information into the alert. That code is included Gambia release. Manual is below link:
https://opnfv-barometer.readthedocs.io/en/stable-gambia/release/userguide/docker.userguide.html#build-and-run-localagent-and-redis-docker-imagesTBA
Components
local-agent
TBA
policy-agent
local-agent has two functions that work with collectd, libvirtd and OpenStack API. Overview is below.
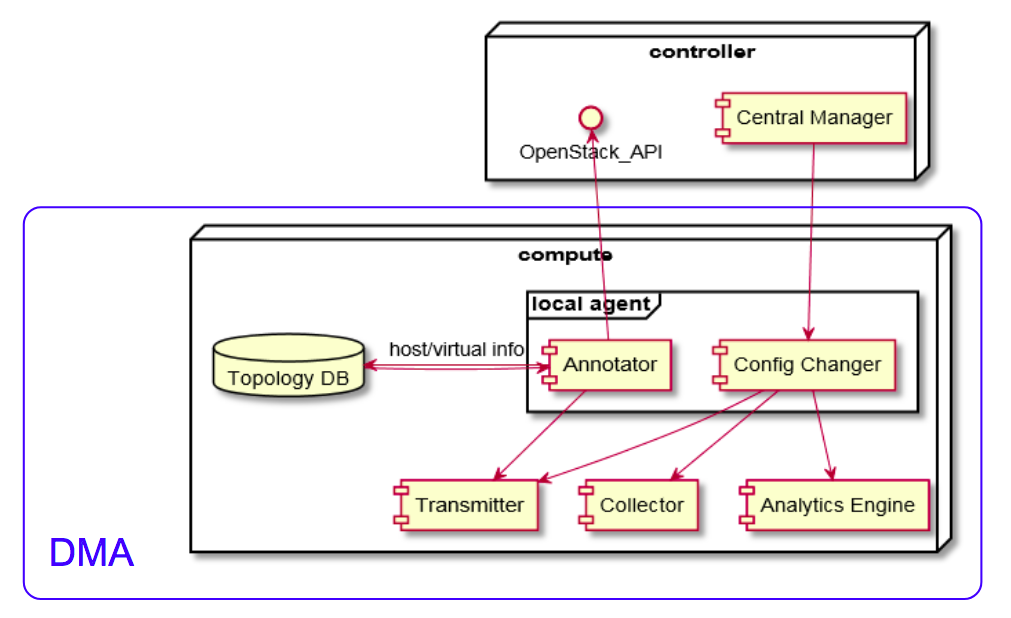
Annotation
Add annotation for collectd's metrics with OpenStack information.
- Virtual machine name
- instance-000001 of libvirt name <- "VM foobar" in OpenStack name
- Network interface name
- "tap-xxx" on the host <- OpenStack "VM foobar", network ”YYY”
Dynamically config change
Change config of metrics collection while services are running.
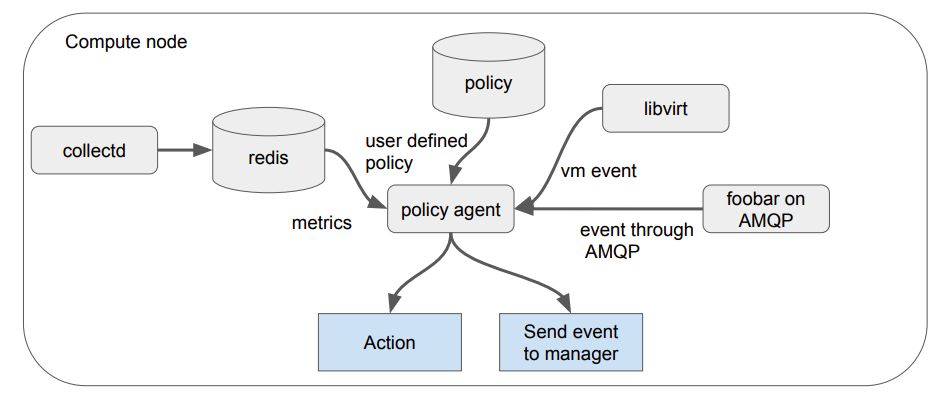
policy-agent
policy-agent has the function that to watch metrics data stored in redis periodically and watch libvirt events, it provides some action using policies that written in YAML format. Policy diagram is below.
Fields for policy
| vm resources | vm.vcpu |
| vm interfaces | vm.if_errors.rx |
TBA
Presentations/Videos
OpenStack Summit Berlin
https://www.openstack.org/videos/summits/berlin-2018/the-opnfv-barometer-with-telecom-operator-new-perspective-for-monitoringOpenStack Summit Sydney
https://www.openstack.org/videos/summits/sydney-2017/dmadistributed-monitoring-and-analysis-monitoring-practice-and-lifecycle-management-for-telecomOpenStack Summit Boston
https://www.openstack.org/videos/summits/boston-2017/distributed-monitoring-and-analysis-for-telecom-requirementsOpenStack Summit Barcelona
https://www.openstack.org/videos/summits/barcelona-2016/nec-the-telecom-requirements-for-openstack-how-to-reduce-operation-cost-after-day-2
...