...
*** Repeat the above process for other monitoring agents ***
Steps:
| View file | ||||
|---|---|---|---|---|
|
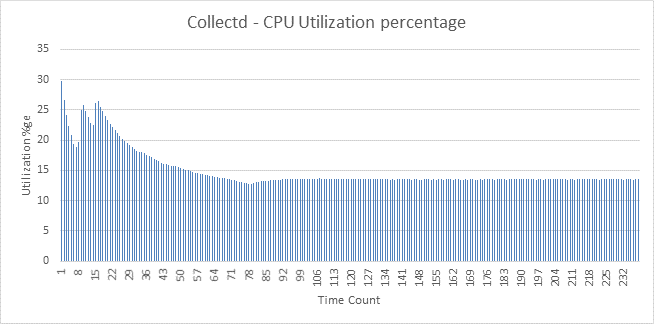
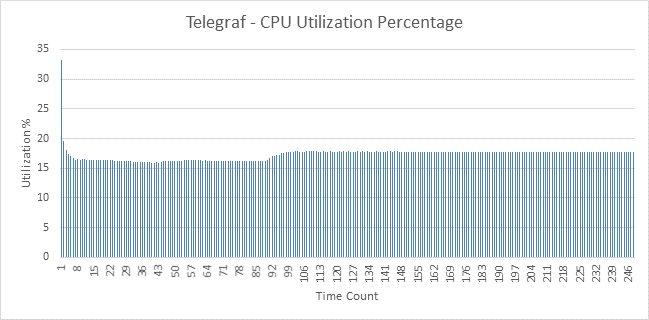
Initial findings
Below are plots for CPU Utilization Collectd and Telegraf. There isn’t much difference between these agents. Snap was used to collect the process stats for both collectd and telegraf
Apart from the CPU data which is in the graphs below – the other comparative data are as follows:
Telegraf | Collectd | |
Virtual Memory | 345899008 | 958205952 |
RSS | 7880 | 2066 |
Code | 15036416 | 14442496 |
Data | 321084800 | 831705088 |
StackSize | 416 | 2288 |
iperf (550Mbps) | 542 | 522 |