...
- The publishing Mode – should really be writing somewhere else off the system – ideally some sort of time series DB… you want to minimize the impact of noise on the system
- You isolate and pin cores appropriately
- Footprints measurement process:
- Measure Idle System resources usage
- Run plugin/plugins combination - Measure System resources usage
- Repeat tests on a busy System – or one running a workload.
- Report results
- Repeat with a busy system.
- Metrics to collect:
- Sysstat metrics
- CPU %user %nice %system %iowait %steal
- Memory usage: kbmemfree kbmemused %memused kbbuffers kbcached kbswpfree
- Cache thrashing if any
- IO
- tps – Transactions per second (this includes both read and write)
- rtps – Read transactions per second
- wtps – Write transactions per second
- bread/s – Bytes read per second
- bwrtn/s – Bytes written per second
- Sysstat metrics
- collectd/any other collector specific process stats if possible.
- Application stats for the application you are running – to determine the impact of collectd/other collectors on the workload.
- You might pick a usecase with some network traffic – to see the impact on this if any.
- Intervals: you might want to try 1 second, 10 seconds and 60 seconds… if possible you might drop below a second.
Process to be followed:
- Isolate the CPUs on the monitoring node. [ Added isolcpus option in the grub]
- Run collectd on the isolated CPU. [ Used taskset command to run collectd with appropriate CPU-mask]
- Plugins: Make collectd to monitor following metrics [CPU, Memory, Disk, Interface, IPMI, processes, libvirt, Caches, OVS, hugepages]
- Output: Make collectd to send metrics to influxdb running on separate node.
- Workload: stress-ng + iperf.
- Monitoring duration: 5 minutes.
- Frequency: 1sec, 10 seconds, 60 seconds.
- Collected Metrics to analyze collectd’s runtime performance [ Used Snap to collect ‘collectd-process’ metrics and CPU and memory data]
- Note the iperf performance ( to study any effect on it due to collectd]
- Currently seeing if I can get more information from LTT-NG.
*** Repeat the above process for other monitoring agents ***
Steps:
| View file | ||||
|---|---|---|---|---|
|
Initial findings
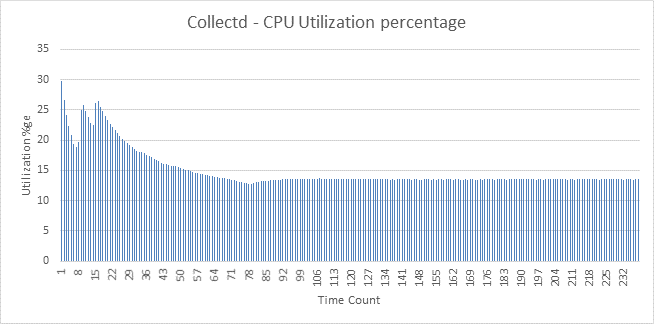
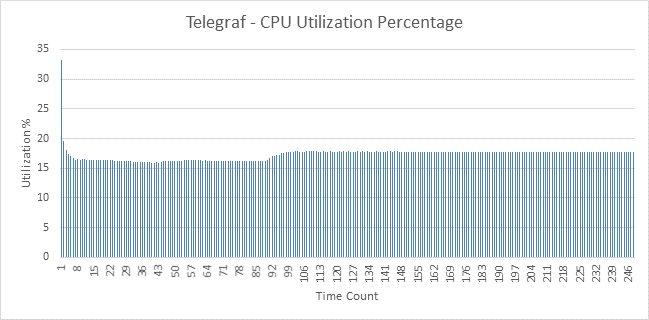
Below are plots for CPU Utilization Collectd and Telegraf. There isn’t much difference between these agents. Snap was used to collect the process stats for both collectd and telegraf
Apart from the CPU data which is in the graphs below – the other comparative data are as follows:
Telegraf | Collectd | |
Virtual Memory | 345899008 | 958205952 |
RSS | 7880 | 2066 |
Code | 15036416 | 14442496 |
Data | 321084800 | 831705088 |
StackSize | 416 | 2288 |
iperf (550Mbps) | 542 | 522 |