Introduction
As part of the collaboration between VSPERF and ETSI NFV TST working group, we developed and tested new methods to characterize the limits of data plane resources. The new methods are comprised of new search algorithm(s) to discover true resource limits (RFC 2544 Throughput, for example) while avoiding the effects of transient loss in the NFVI platform. The current search algorithm is called Binary Search with Loss Verification. A key aspect of each measurement completed during the search (a trial) is the duration of the test. The Trial Duration must be considerably less than the average time interval between transient events that cause frame loss. The details are described in ETSI GS NFV-TST 009 .
The Long Duration Testing compliments the Binary Search with Loss Verification algorithm by helping to determine (or confirm) the trial duration, and to identify the processes and/or interrupts that cause transient loss. Once the sources of transients have been identified, they can be optimized (for example, by reducing their rate of occurrence) or mitigated (by increasing strategic buffer sizes to absorb more frames during intervals of suspended forwarding).
Testing at Gambia Plugfest
We will be using an expanded set of traffic generators for Long Duration Testing, and primarily iPerf3 during the Plugfest. This means we will use VSPERF in --mode trafficgen-off and operating iPerf3 manually, developing tools to automate data collection as we go.
We have already created the network namespace environment needed to run both iPerf3 Client and Server on the same host, and ensure that traffic follows the external path as shown below.
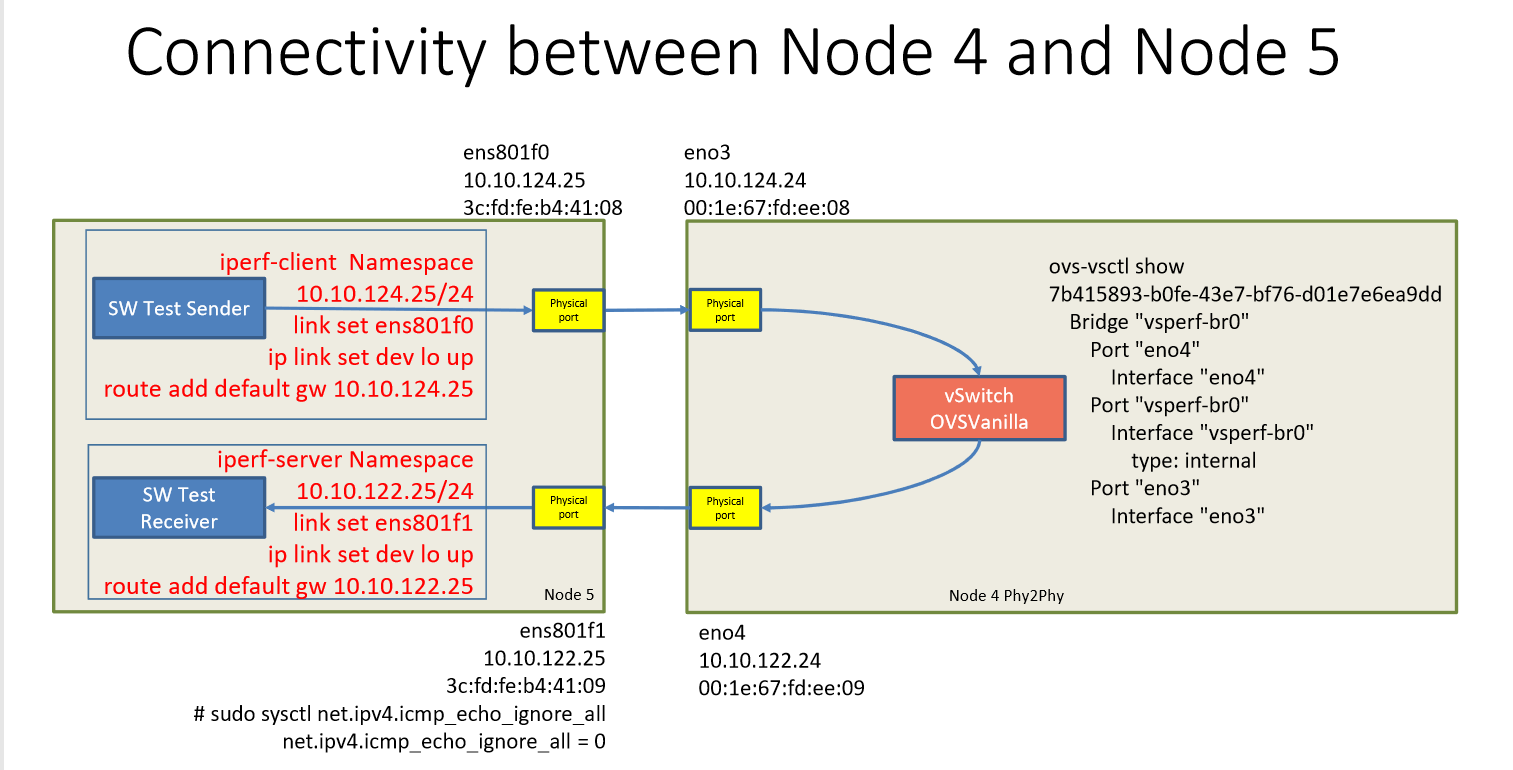
IPerf 3 was sending at low packet rates (~40K pps) in initial iPerf3 testing - this means we are only capturing BIG interrupts with this stream (see sample output below).
In future, using DPDK to operate at higher rates and buffer size set on per packet basis, traffic will fill the buffers more easily. T-rex generator can only achieve about 5 Gbps (based on recent testing, with T-rex core assignment = 4 cores in current configurations).
During the Plugfest, it was recommended to examine PROX tool's ability to characterize processor Interrupts. The PROX tool was installed on Pod12, Node 4. The PROX tool can examine interrupt effects on a heartbeat on each core. The current master can be accessed on gitub: https://github.com/opnfv/samplevnf/tree/master/VNFs/DPPD-PROX/
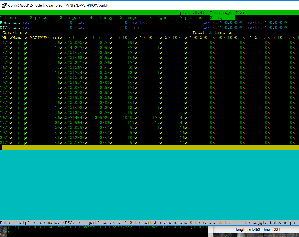
We obtained a PROX status display snapshot output for VSPERF Intel Pod 12, Node 4 (the Device Under Test, DUT, for the Long Duration and Cross-NUMA Node testing). This test used the configuration file in [opnfv@pod12-node4 ~]$ sudo ./prox -k -f ../config/irq.cfg
where -k : Log statistics to file "stats_dump" in current directory (but this file doesn't seem to be ASCII).
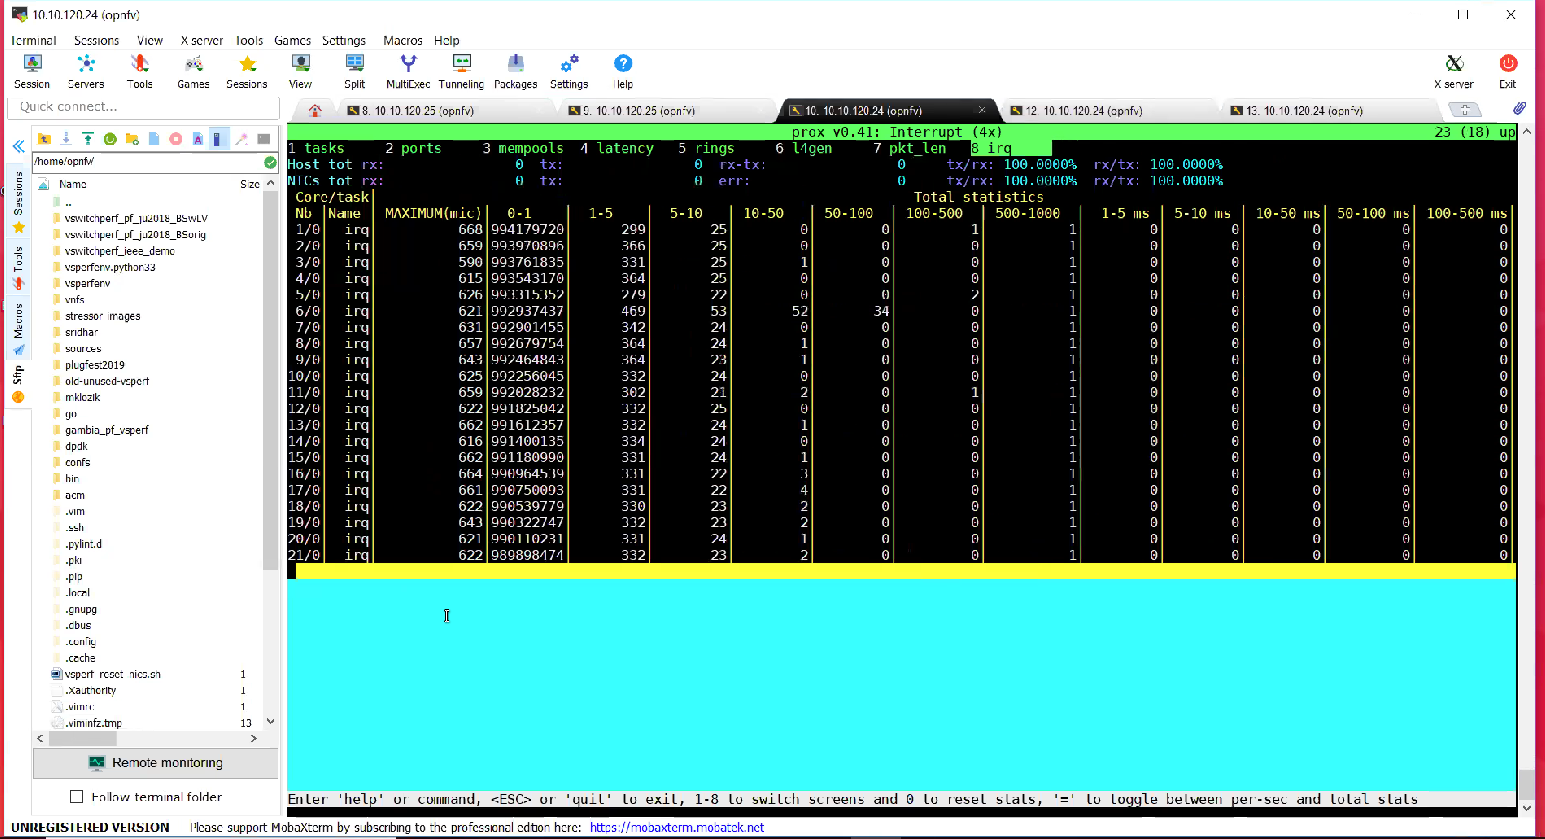
From PROX, which essentially measures the duration of a 1 nanosecond heartbeat, it is clear that some process is producing fairly frequent interrupts that cause delays in the 10-50 usec and 50-100usec range on core 6. Also, Core 11 has some interrupts in the 10-50usec range: it is important to re-check this result when the VSPERF deployment is running. In the iPerf3 testing below, the Max MTU packets used have 1.2144 usec serialization delay on the 10 Gbps links, so a 10 usec interruption would affect approximately 12 frames.
For example, the BSwLV OVS-Vanilla config has:
GUEST_CORE_BINDING = [('#EVAL(6+2*#VMINDEX)', '#EVAL(7+2*#VMINDEX)')] and
VSWITCH_VHOST_NET_AFFINITIZATION = False with VSWITCH_VHOST_CPU_MAP = [4,5,8,11]
We can get these statistics on a per-second basis, from a TCP socket - there is syntax to request these stats. (also -k command, Xavier will share scripts which are better).
During the discussion at Plugfest, it was also proposed that the characteristics of frame loss over time may suggest the source:
- an isolated burst of consecutive loss seems likely to originate from a relatively long-lived interrupt.
- more frequent loss bursts may result from the traffic level exceeding resource limitations.
Loss characteristics are a topic for further investigation, and likely expansion of the ETSI NFV specification TST009, clause 11.
First tests with PROX monitoring
As a first step, PROX was started on Node 4 after reboot, with nothing else running:
 There is fairly regular interrupt activity in the 5-10usec bin for all cores, but nothing in the 10-50usec range after 60 sec.
Next, the Node 4 and 5 configurations above were built (after stopping PROX on Node 4, VSPERF could not install ovs-vanilla with PROX running). Once the Node 4 ovs-vanilla data path was instantiated by VSPERF, we re-started and viewed interrupt activity with PROX again (with no traffic running).
Then, the Node 5 iPerf3 traffic was started (after a date timestamp), and PROX counts were zeroed-out as the traffic began.
 Recall the host config is
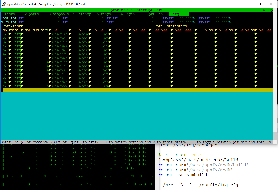
 VSWITCH_VHOST_CPU_MAP = [4,5,8,11] and here PROX observed interrupts on NUMA 0 cores 2, 7, 14, 16, (many) 17 and 18 in the 10-50usec range. Eventually, all cores 1-15 experienced 2 events in the 10-50usec range (when PROX was allowed to run for about 30 minutes after the 60 second test).
The data plane measurements indicate one second with 45 frame losses (see the very bottom of the figure). Message logging on Nodes 4 and 5 indicated nothing during the 60 sec iPerf3 test. Below we see an except of the iPerf3 output from the Server, showing the single second with 45 packet losses.
...
[ 5] 10.00-11.00 sec 59.6 MBytes 500 Mbits/sec 0.011 ms 0/43128 (0%)
[ 5] 11.00-12.00 sec 59.8 MBytes 501 Mbits/sec 0.010 ms 0/43269 (0%)
[ 5] 12.00-13.00 sec 59.6 MBytes 500 Mbits/sec 0.008 ms 45/43220 (0.1%)
[ 5] 13.00-14.00 sec 59.5 MBytes 499 Mbits/sec 0.018 ms 0/43068 (0%)
So, we haven't yet seen correlation between PROX interrupt counts and the single loss event, but it would be good to have second by second results from PROX in a flat file, and to confirm that we have the correct cores identified in Node 4.
In a follow-up round of testing (Jan 20), we increased the iPerf3 sending rate to 750Mbps, and found good correlation between:
Losses near the beginning of the test:
[ 5] local 10.10.122.25 port 5201 connected to 10.10.124.25 port 59043
[ ID] Interval Transfer Bandwidth Jitter Lost/Total Datagrams
[ 5] 0.00-1.00 sec 81.9 MBytes 687 Mbits/sec 0.005 ms 918/60210 (1.5%)
[ 5] 1.00-2.00 sec 89.5 MBytes 751 Mbits/sec 0.011 ms 0/64798 (0%)
[ 5] 2.00-3.00 sec 87.1 MBytes 731 Mbits/sec 0.008 ms 1701/64770 (2.6%)
[ 5] 3.00-4.00 sec 88.2 MBytes 740 Mbits/sec 0.008 ms 891/64735 (1.4%)
[ 5] 4.00-5.00 sec 88.4 MBytes 741 Mbits/sec 0.007 ms 888/64883 (1.4%)
[ 5] 5.00-6.00 sec 89.5 MBytes 751 Mbits/sec 0.008 ms 41/64869 (0.063%)
[ 5] 6.00-7.00 sec 89.2 MBytes 748 Mbits/sec 0.006 ms 16/64618 (0.025%)
[ 5] 7.00-8.00 sec 88.2 MBytes 740 Mbits/sec 0.007 ms 1427/65283 (2.2%)
[ 5] 8.00-9.00 sec 90.5 MBytes 759 Mbits/sec 0.005 ms 0/65554 (0%)
... remainder of the test had 1 second with 3 losses.
Node 4 log entries (much Network Manager activity)
Jan 20 10:40:01 pod12-node4 systemd: Removed slice User Slice of root.
Jan 20 10:43:43 pod12-node4 NetworkManager[13205]: <info> [1548009823.5382] policy: auto-activating connection 'Wired connection 1' (f7b61226-727b-39a3-ba0e-c5eecae22c32)
Jan 20 10:43:43 pod12-node4 NetworkManager[13205]: <info> [1548009823.5387] policy: auto-activating connection 'Wired connection 2' (9fd53d60-d93d-354d-8132-e97e39496541)
Jan 20 10:43:43 pod12-node4 NetworkManager[13205]: <info> [1548009823.5394] device (ens801f2): Activation: starting connection 'Wired connection 1' (f7b61226-727b-39a3-ba0e-c5eecae22c32)
Jan 20 10:43:43 pod12-node4 NetworkManager[13205]: <info> [1548009823.5397] device (ens801f3): Activation: starting connection 'Wired connection 2' (9fd53d60-d93d-354d-8132-e97e39496541)
Jan 20 10:43:43 pod12-node4 NetworkManager[13205]: <info> [1548009823.5398] device (ens801f2): state change: disconnected -> prepare (reason 'none', sys-iface-state: 'managed')
Jan 20 10:43:43 pod12-node4 NetworkManager[13205]: <info> [1548009823.5404] device (ens801f3): state change: disconnected -> prepare (reason 'none', sys-iface-state: 'managed')
Jan 20 10:43:43 pod12-node4 NetworkManager[13205]: <info> [1548009823.5409] device (ens801f2): state change: prepare -> config (reason 'none', sys-iface-state: 'managed')
Jan 20 10:43:43 pod12-node4 NetworkManager[13205]: <info> [1548009823.5415] device (ens801f3): state change: prepare -> config (reason 'none', sys-iface-state: 'managed')
and PROX interrupts on Core 5 (two observed over the 60 second test)
Next steps:
- Obtain second-by-second output from PROX, and confirm Core occupation of OVS-Vanilla, etc.
- OVS-DPDK with isolcpu rcu_nocbs
- and taskset the iPerf process to qa core with no interrupts.
iPerf3 example Output
As an example of the iPerf3 loss counting capability, we have the results of one 60 second test below (where each second would be a trial):
-----------------------------------------------------------
Server listening on 5201
-----------------------------------------------------------
Accepted connection from 10.10.124.25, port 39851
[ 5] local 10.10.122.25 port 5201 connected to 10.10.124.25 port 35449
[ ID] Interval Transfer Bandwidth Jitter Lost/Total Datagrams
[ 5] 0.00-1.00 sec 55.7 MBytes 467 Mbits/sec 0.004 ms 0/40351 (0%)
[ 5] 1.00-2.00 sec 59.6 MBytes 500 Mbits/sec 0.004 ms 0/43161 (0%)
[ 5] 2.00-3.00 sec 59.6 MBytes 500 Mbits/sec 0.004 ms 0/43152 (0%)
[ 5] 3.00-4.00 sec 59.6 MBytes 500 Mbits/sec 0.005 ms 0/43166 (0%)
[ 5] 4.00-5.00 sec 59.6 MBytes 500 Mbits/sec 0.005 ms 0/43139 (0%)
[ 5] 5.00-6.00 sec 59.6 MBytes 500 Mbits/sec 0.004 ms 0/43181 (0%)
[ 5] 6.00-7.00 sec 59.6 MBytes 500 Mbits/sec 0.005 ms 0/43157 (0%)
[ 5] 7.00-8.00 sec 59.6 MBytes 500 Mbits/sec 0.004 ms 0/43172 (0%)
[ 5] 8.00-9.00 sec 59.6 MBytes 500 Mbits/sec 0.006 ms 46/43211 (0.11%)
[ 5] 9.00-10.00 sec 59.6 MBytes 500 Mbits/sec 0.006 ms 0/43128 (0%)
[ 5] 10.00-11.00 sec 59.5 MBytes 499 Mbits/sec 0.005 ms 124/43196 (0.29%)
[ 5] 11.00-12.00 sec 59.6 MBytes 500 Mbits/sec 0.004 ms 0/43126 (0%)
[ 5] 12.00-13.00 sec 59.7 MBytes 501 Mbits/sec 0.011 ms 0/43214 (0%)
[ 5] 13.00-14.00 sec 59.5 MBytes 499 Mbits/sec 0.004 ms 0/43106 (0%)
[ 5] 14.00-15.00 sec 59.7 MBytes 500 Mbits/sec 0.005 ms 32/43237 (0.074%)
[ 5] 15.00-16.00 sec 59.5 MBytes 499 Mbits/sec 0.005 ms 0/43095 (0%)
[ 5] 16.00-17.00 sec 59.7 MBytes 501 Mbits/sec 0.005 ms 0/43210 (0%)
[ 5] 17.00-18.00 sec 59.6 MBytes 500 Mbits/sec 0.006 ms 0/43127 (0%)
[ 5] 18.00-19.00 sec 59.6 MBytes 500 Mbits/sec 0.004 ms 0/43189 (0%)
[ 5] 19.00-20.00 sec 59.6 MBytes 500 Mbits/sec 0.004 ms 0/43140 (0%)
[ 5] 20.00-21.00 sec 59.6 MBytes 500 Mbits/sec 0.005 ms 0/43158 (0%)
[ 5] 21.00-22.00 sec 59.6 MBytes 500 Mbits/sec 0.005 ms 0/43142 (0%)
[ 5] 22.00-23.00 sec 59.6 MBytes 500 Mbits/sec 0.004 ms 0/43185 (0%)
[ 5] 23.00-24.00 sec 59.6 MBytes 500 Mbits/sec 0.006 ms 0/43173 (0%)
[ 5] 24.00-25.00 sec 59.6 MBytes 500 Mbits/sec 0.006 ms 0/43159 (0%)
[ 5] 25.00-26.00 sec 59.6 MBytes 500 Mbits/sec 0.006 ms 0/43195 (0%)
[ 5] 26.00-27.00 sec 59.6 MBytes 500 Mbits/sec 0.006 ms 0/43152 (0%)
[ 5] 27.00-28.00 sec 59.6 MBytes 500 Mbits/sec 0.005 ms 0/43155 (0%)
[ 5] 28.00-29.00 sec 59.6 MBytes 500 Mbits/sec 0.004 ms 0/43143 (0%)
[ 5] 29.00-30.00 sec 59.6 MBytes 500 Mbits/sec 0.005 ms 0/43160 (0%)
[ 5] 30.00-31.00 sec 59.6 MBytes 500 Mbits/sec 0.004 ms 0/43141 (0%)
[ 5] 31.00-32.00 sec 59.6 MBytes 500 Mbits/sec 0.005 ms 0/43172 (0%)
[ 5] 32.00-33.00 sec 59.6 MBytes 500 Mbits/sec 0.004 ms 19/43178 (0.044%)
[ 5] 33.00-34.00 sec 59.6 MBytes 500 Mbits/sec 0.005 ms 0/43166 (0%)
[ 5] 34.00-35.00 sec 59.6 MBytes 500 Mbits/sec 0.004 ms 7/43155 (0.016%)
[ 5] 35.00-36.00 sec 59.6 MBytes 500 Mbits/sec 0.004 ms 0/43171 (0%)
[ 5] 36.00-37.00 sec 59.6 MBytes 500 Mbits/sec 0.005 ms 0/43131 (0%)
[ 5] 37.00-38.00 sec 59.6 MBytes 500 Mbits/sec 0.005 ms 0/43168 (0%)
[ 5] 38.00-39.00 sec 59.6 MBytes 500 Mbits/sec 0.005 ms 0/43185 (0%)
[ 5] 39.00-40.00 sec 59.6 MBytes 500 Mbits/sec 0.004 ms 0/43169 (0%)
[ 5] 40.00-41.00 sec 59.6 MBytes 500 Mbits/sec 0.005 ms 0/43160 (0%)
[ 5] 41.00-42.00 sec 59.6 MBytes 500 Mbits/sec 0.004 ms 0/43148 (0%)
[ 5] 42.00-43.00 sec 59.6 MBytes 500 Mbits/sec 0.005 ms 0/43162 (0%)
[ 5] 43.00-44.00 sec 59.6 MBytes 500 Mbits/sec 0.005 ms 0/43176 (0%)
[ 5] 44.00-45.00 sec 59.6 MBytes 500 Mbits/sec 0.004 ms 0/43178 (0%)
[ 5] 45.00-46.00 sec 59.6 MBytes 500 Mbits/sec 0.004 ms 0/43141 (0%)
[ 5] 46.00-47.00 sec 59.6 MBytes 500 Mbits/sec 0.006 ms 0/43156 (0%)
[ 5] 47.00-48.00 sec 59.6 MBytes 500 Mbits/sec 0.004 ms 0/43189 (0%)
[ 5] 48.00-49.00 sec 59.6 MBytes 500 Mbits/sec 0.004 ms 0/43142 (0%)
[ 5] 49.00-50.00 sec 59.6 MBytes 500 Mbits/sec 0.005 ms 0/43153 (0%)
[ 5] 50.00-51.00 sec 59.5 MBytes 499 Mbits/sec 0.005 ms 45/43150 (0.1%)
[ 5] 51.00-52.00 sec 59.7 MBytes 501 Mbits/sec 0.005 ms 0/43210 (0%)
[ 5] 52.00-53.00 sec 59.6 MBytes 500 Mbits/sec 0.005 ms 0/43168 (0%)
[ 5] 53.00-54.00 sec 59.6 MBytes 500 Mbits/sec 0.004 ms 0/43158 (0%)
[ 5] 54.00-55.00 sec 59.6 MBytes 500 Mbits/sec 0.004 ms 0/43160 (0%)
[ 5] 55.00-56.00 sec 59.6 MBytes 500 Mbits/sec 0.004 ms 0/43177 (0%)
[ 5] 56.00-57.00 sec 59.6 MBytes 500 Mbits/sec 0.004 ms 0/43150 (0%)
[ 5] 57.00-58.00 sec 59.6 MBytes 500 Mbits/sec 0.004 ms 0/43152 (0%)
[ 5] 58.00-59.00 sec 59.5 MBytes 499 Mbits/sec 0.003 ms 0/43055 (0%)
[ 5] 59.00-60.00 sec 59.7 MBytes 501 Mbits/sec 0.004 ms 0/43267 (0%)
[ 5] 60.00-60.04 sec 0.00 Bytes 0.00 bits/sec 0.004 ms 0/0 (0%)
- - - - - - - - - - - - - - - - - - - - - - - - -
[ ID] Interval Transfer Bandwidth Jitter Lost/Total Datagrams
[ 5] 0.00-60.04 sec 0.00 Bytes 0.00 bits/sec 0.004 ms 273/2586968 (0.011%)
This particular test exhibited 6 seconds (Trials) with loss during a 60 second Test, or one loss event every 10 seconds on average. However, many of the Trials with loss occur in a pattern of Loss, no-Loss, Loss over three consecutive Trials. Loss-free intervals were 9, 15, 17, 3, and 8 seconds in length. This testing was conducted at about 70% of the RFC2544 Throughput level.
Related papers:
https://www.net.in.tum.de/fileadmin/bibtex/publications/papers/SPECTS15NAPIoptimization.pdf
https://www.net.in.tum.de/fileadmin/bibtex/publications/papers/NetSys2015.pdf
PROX config:
cd ./samplevnf/VNFs/DPPD-PROX/build
export RTE_SDK='/home/opnfv/dpdk/build'
export RTE_SDK='/home/opnfv/dpdk'
export RTE_TARGET=build
and
sudo ./prox -k -f ../config/irq.cfg
-=-=-=-=-=-
./samplevnf/VNFs/DPPD-PROX/config/irq.cfg
[opnfv@pod12-node4 config]$ cat irq.cfg
;;
;; Copyright (c) 2010-2017 Intel Corporation
;;
;; Licensed under the Apache License, Version 2.0 (the "License");
;; you may not use this file except in compliance with the License.
;; You may obtain a copy of the License at
;;
;; http://www.apache.org/licenses/LICENSE-2.0
;;
;; Unless required by applicable law or agreed to in writing, software
;; distributed under the License is distributed on an "AS IS" BASIS,
;; WITHOUT WARRANTIES OR CONDITIONS OF ANY KIND, either express or implied.
;; See the License for the specific language governing permissions and
;; limitations under the License.
;;
[eal options]
-n=4 ; force number of memory channels
no-output=no ; disable DPDK debug output
[global]
start time=5
name=Interrupt (4x)
[core 0s0]
mode=master
[core 1s0-21s0]
name=irq
task=0
mode=irq