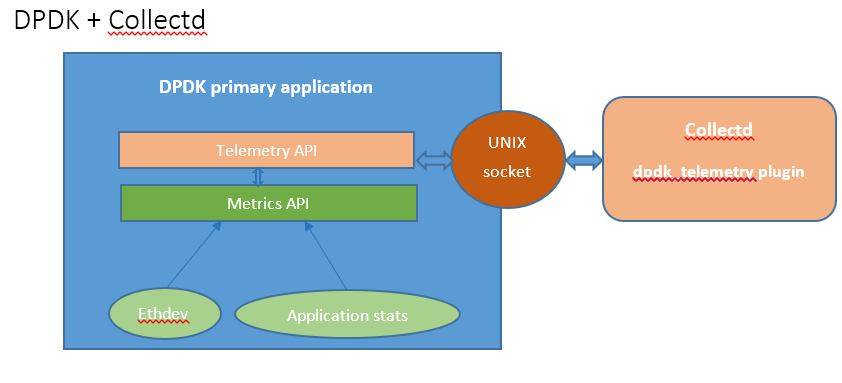
Requirement is to collectd dpdk interface stats and application or global stats from the dpdk telemetry library and display.
The dpdk_telemetry plugin has been developed for the collectd to query dpdk interface stats and application stats from DPDK and display. This plugin works as a client which uses UNIX socket to send the queries to the DPDK telemetry which is acting as a server. The collectd plugin sends the JSON encoded requests to the server and receives the JSON encoded replies back.
Socket initialization includes, the client sockets creation, connecting to the server socket , sending the client registration message to the server and getting the response.
After the socket initialization , the plugin read loop will be kicked off for every plugin interval seconds to read the stats from DPDK by sending JSON encoded message to the server and waiting for the response. During the read loop if the plugin don’t see the server socket , it would try reconnecting to it.

ClientSocketPath "/var/run/.client"
DpdkSocketPath "/var/run/dpdk/rte/telemetry"
      The port based dpdk stats will have port number suffixed at the end of the each stat name. The application or global stats are the ones
      without any suffix.
1)This plugin depends on the DPDK 19.08 release.
Building and Running DPDK application:
1)To fetch DPDK stats the DPDK has to be compiled with below telemetry config flag set to y.
CONFIG_RTE_LIBRTE_TELEMETRY=y
2)Also the DPDK application should be run with "–telemetry" eal option.
Ex: $dpdk/app/testpmd --telemetry -l 2,3,4 -n 4